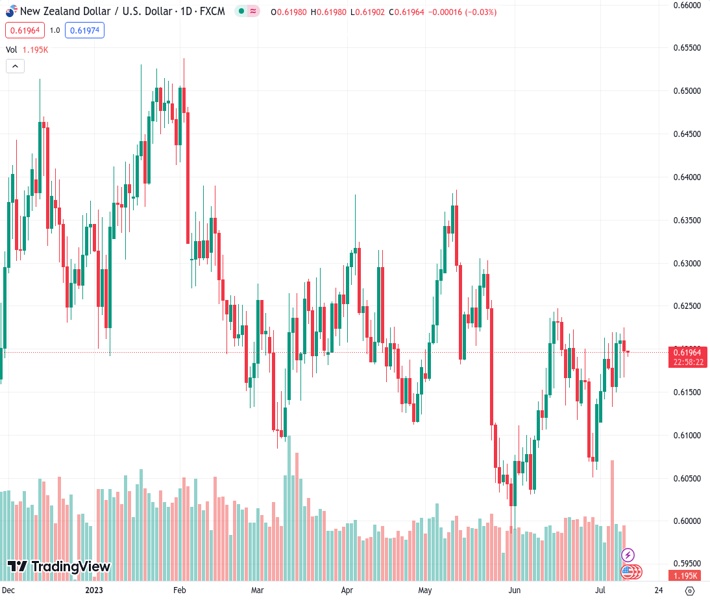
The New Zealand Dollar (NZD) against the US Dollar (USD) pair has dropped close to the meeting point of the 20-day, 100-day, and 200-day Simple Moving Averages (SMA) around the range of 0.6170-0.6190.
…
This is a premium post.
[s2If !current_user_can(access_s2member_level4)]Please register for FREE REGISTER to read full post below containing analysis. In case of any error or you think you are not able to read the full post below, please email us at support#nehcap.com [lwa][/s2If] [s2If current_user_can(access_s2member_level1)]
- The NZD/USD has fallen near the convergence of the 20,100 and 200-day SMAs towards the 0.6170-0.6190 range.
The pair currently trades last at 0.61947.
The previous day high was 0.622 while the previous day low was 0.6166. The daily 38.2% Fib levels comes at 0.6199, expected to provide resistance. Similarly, the daily 61.8% fib level is at 0.6187, expected to provide support.
The NZD/USD trades with losses at the 0.6195 area while markets await the Reserve Bank of New Zealand (RBNZ) decision early in Wednesday’s session. In addition, all eyes will be on Consumer Price Index (CPI) data from June from the US, which is set to affect the bets on the Federal Reserve regarding its next monetary policy moves.
Wednesday’s highlight will be the Reserve Bank of New Zealand’s (RBNZ) decision, which is expected to hold rates steady at 5.5%. Despite a hawkish stance, the RBNZ has been accused of pushing the economy into a technical recession to push inflation down, so investors will closely watch the bank’s economic outlook and forecasts. In addition, in the Monetary Policy review, investors will look at the bank’s assessment of China’s situation as a weaker demand pulse from China could contribute to lowering inflation.
On the other hand, in the US, the focus is on Wednesday’s Consumer Price Index (CPI) data. The headline figure is expected to drop to 3.1% in June YoY from its previous 4%, while the Core measure to 5% from it last figure of 5.3%.
As Federal Reserve’s officials sounded hawkish on Monday, markets believe a 25 basis points (bps) hike in the July meeting is a done deal. Moreover, the odds of another hike this cycle stand at 35%, but those expectations may change according to the outcome of the inflation data in Wednesday’s session.
The daily chart suggests a neutral outlook as the convergence of the 20,100 and 200-day Simple Moving Averages (SMAs) towards the 0.6180-0.6190 range suggests that investors are waiting for a catalyst. In that sense, RBNZ’s decision and US CPI figures may determine the short-term trajectory of the pair.
Support levels: 0.6170-0.6190 (20,100 and 200-day SMA convergence)
Resistance levels: 0.6200, 0.6250,0.6270.
Technical Levels: Supports and Resistances
NZDUSD currently trading at 0.6196 at the time of writing. Pair opened at 0.6211 and is trading with a change of -0.24 % .
| Overview | Overview.1 | |
|---|---|---|
| 0 | Today last price | 0.6196 |
| 1 | Today Daily Change | -0.0015 |
| 2 | Today Daily Change % | -0.2400 |
| 3 | Today daily open | 0.6211 |
The pair remains strongly bullish on the daily timeframe. It trades above its 20 SMA @ 0.6167, 50 SMA 0.617, 100 SMA @ 0.6188 and 200 SMA @ 0.6177.
| Trends | Trends.1 | |
|---|---|---|
| 0 | Daily SMA20 | 0.6167 |
| 1 | Daily SMA50 | 0.6170 |
| 2 | Daily SMA100 | 0.6188 |
| 3 | Daily SMA200 | 0.6177 |
The previous day high was 0.622 while the previous day low was 0.6166. The daily 38.2% Fib levels comes at 0.6199, expected to provide resistance. Similarly, the daily 61.8% fib level is at 0.6187, expected to provide support.
Note the levels of interest below:
- Pivot support is noted at 0.6178, 0.6145, 0.6124
- Pivot resistance is noted at 0.6232, 0.6253, 0.6286
| Levels | Levels.1 |
|---|---|
| Previous Daily High | 0.6220 |
| Previous Daily Low | 0.6166 |
| Previous Weekly High | 0.6221 |
| Previous Weekly Low | 0.6124 |
| Previous Monthly High | 0.6250 |
| Previous Monthly Low | 0.5990 |
| Daily Fibonacci 38.2% | 0.6199 |
| Daily Fibonacci 61.8% | 0.6187 |
| Daily Pivot Point S1 | 0.6178 |
| Daily Pivot Point S2 | 0.6145 |
| Daily Pivot Point S3 | 0.6124 |
| Daily Pivot Point R1 | 0.6232 |
| Daily Pivot Point R2 | 0.6253 |
| Daily Pivot Point R3 | 0.6286 |
[/s2If]
Download Nehcap EAWe have two EAs that are operational on our LIVE accounts.
- EA-FIX: Check out the details here. Download EA-FIX . EA-FIX is a non-grid HFT scalper.
- EA-GROWTH: High quality low dd EA using trend grids. Download EA_GROWTHJoin Our Telegram Group
")


