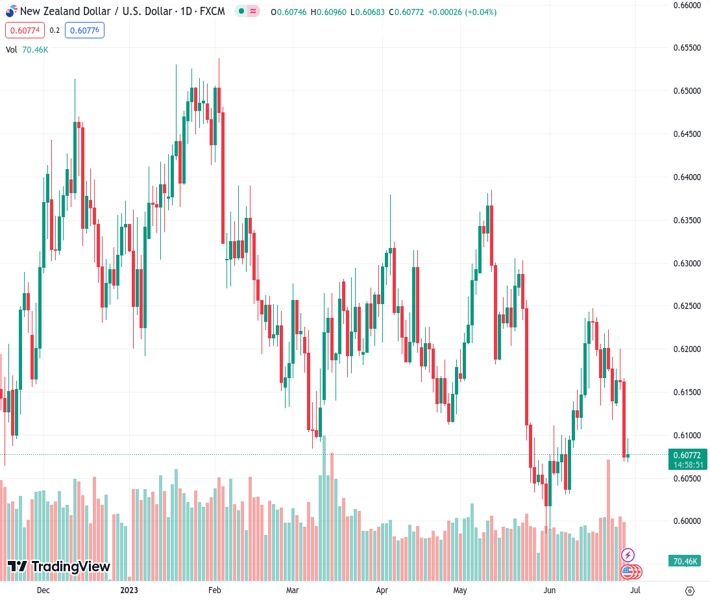
The NZDUSD pair is currently trading at 0.60784 and continues to be under pressure, reaching its lowest point in three weeks. According to the viewpoint of Nehcap, it is anticipated that there will be a further decline in the near future.
…
This is a premium post.
[s2If !current_user_can(access_s2member_level4)]Please register for FREE REGISTER to read full post below containing analysis. In case of any error or you think you are not able to read the full post below, please email us at support#nehcap.com [lwa][/s2If] [s2If current_user_can(access_s2member_level1)]
- NZD/USD remains on the back foot at the lowest levels in three weeks.
The pair currently trades last at 0.60784.
The previous day high was 0.6173 while the previous day low was 0.6068. The daily 38.2% Fib levels comes at 0.6108, expected to provide resistance. Similarly, the daily 61.8% fib level is at 0.6133, expected to provide resistance.
NZD/USD holds onto the previous day’s bearish bias despite posting mild intraday gains around 0.6080 heading into Thursday’s European session.
In doing so, the Kiwi pair justifies the downside break of an ascending support line from May 31, now immediate resistance around 0.6140. Also adding strength to the downside bias are the bearish MACD signals and the quote’s sustained trading below the 21-day Exponential Moving Average (EMA), near 0.6145 at the latest.
With this, the NZD/USD bears are well-set to poke the 50% Fibonacci retracement level of its October-February upside, near 0.6030.
However, the monthly low and the 61.8% Fibonacci retracement, respectively near 0.5985 and 0.5900, could challenge the pair sellers afterward. It’s worth noting that the 0.6000 psychological magnet also acts as a downside filter.
Meanwhile, NZD/USD recovery remains elusive unless the quote crosses the 0.6140-45 resistance confluence comprising the 21-day EMA and the monthly support-turned-resistance line.
In a case where NZD/USD manages to cross the 0.6145 hurdle, the 200-day EMA and the monthly high, at 0.6220 and 0.6250 in that order, will be in the spotlight.
Trend: Further downside expected
Technical Levels: Supports and Resistances
NZDUSD currently trading at 0.6078 at the time of writing. Pair opened at 0.6076 and is trading with a change of 0.03% % .
| Overview | Overview.1 | |
|---|---|---|
| 0 | Today last price | 0.6078 |
| 1 | Today Daily Change | 0.0002 |
| 2 | Today Daily Change % | 0.03% |
| 3 | Today daily open | 0.6076 |
The pair remains strongly bearish on the daily time frame. It trades below the 20 SMA @ 0.6138, 50 SMA 0.6169, 100 SMA @ 0.6199 and 200 SMA @ 0.6159.
| Trends | Trends.1 | |
|---|---|---|
| 0 | Daily SMA20 | 0.6138 |
| 1 | Daily SMA50 | 0.6169 |
| 2 | Daily SMA100 | 0.6199 |
| 3 | Daily SMA200 | 0.6159 |
The previous day high was 0.6173 while the previous day low was 0.6068. The daily 38.2% Fib levels comes at 0.6108, expected to provide resistance. Similarly, the daily 61.8% fib level is at 0.6133, expected to provide resistance.
Note the levels of interest below:
- Pivot support is noted at 0.6038, 0.6001, 0.5933
- Pivot resistance is noted at 0.6143, 0.6211, 0.6248
| Levels | Levels.1 |
|---|---|
| Previous Daily High | 0.6173 |
| Previous Daily Low | 0.6068 |
| Previous Weekly High | 0.6237 |
| Previous Weekly Low | 0.6116 |
| Previous Monthly High | 0.6385 |
| Previous Monthly Low | 0.5985 |
| Daily Fibonacci 38.2% | 0.6108 |
| Daily Fibonacci 61.8% | 0.6133 |
| Daily Pivot Point S1 | 0.6038 |
| Daily Pivot Point S2 | 0.6001 |
| Daily Pivot Point S3 | 0.5933 |
| Daily Pivot Point R1 | 0.6143 |
| Daily Pivot Point R2 | 0.6211 |
| Daily Pivot Point R3 | 0.6248 |
[/s2If]
Nehcap Expert Advisor
The NEHCAP MT4 EA is high quality professional trading system geared to generate returns without using GRID or martingales. Each trade has strict risk per trade parameter. The pairs under management include EURUSD, GBPUSD, AUDCAD, AUDNZD,GBPAUD, EURAUD, EURCAD, CHFJPY and many more.
The system is trading live: LIVE ACCOUNT TRACKING
You can run it free. Apply for a free trial and track our account. Buy the system or use profit share mechanism to generate returns on your MT4.
Join Our Telegram Group
")


