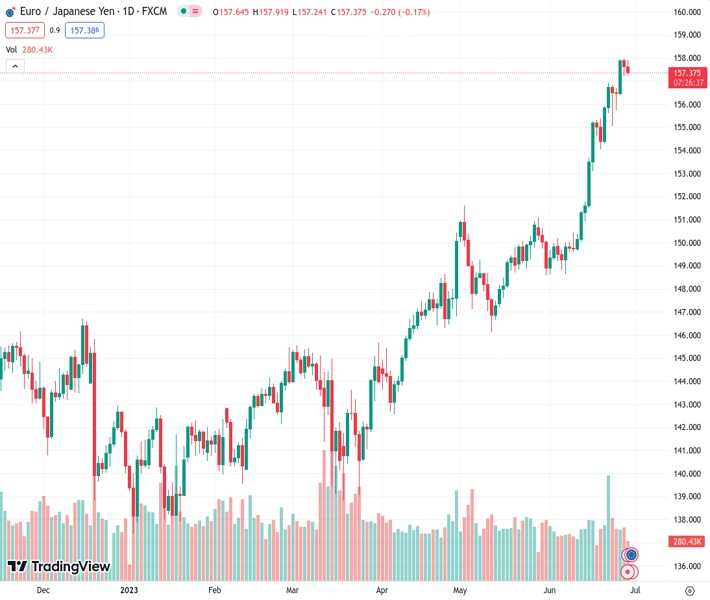
The EURJPY currency pair is currently trading at 157.399, extending its slight decline from Wednesday and approaching a retest of the 157.50 level.
…
This is a premium post.
[s2If !current_user_can(access_s2member_level4)]Please register for FREE REGISTER to read full post below containing analysis. In case of any error or you think you are not able to read the full post below, please email us at support#nehcap.com [lwa][/s2If] [s2If current_user_can(access_s2member_level1)]
- EUR/JPY adds to Wednesday’s small drop and retests 157.50.
The pair currently trades last at 157.399.
The previous day high was 158.0 while the previous day low was 157.23. The daily 38.2% Fib levels comes at 157.52, expected to provide resistance. Similarly, the daily 61.8% fib level is at 157.71, expected to provide resistance.
EUR/JPY gives away ground for the second session in a row, although it appears supported around 157.20 for the time being.
Considering the ongoing price action, further gains appear on the cards in the very near term. That said, the continuation of the uptrend should meet the immediate hurdle at the 2023 high of 157.99 (June 28) ahead of the weekly top of 163.09 (August 22 2008).
The ongoing overbought conditions of the cross, however, are indicative that a deeper knee-jerk should not be ruled out at some point in the short-term horizon.
So far, further upside looks favoured while the cross trades above the 200-day SMA, today at 145.07.
Technical Levels: Supports and Resistances
EURJPY currently trading at 157.41 at the time of writing. Pair opened at 157.68 and is trading with a change of -0.17 % .
| Overview | Overview.1 | |
|---|---|---|
| 0 | Today last price | 157.41 |
| 1 | Today Daily Change | 67.00 |
| 2 | Today Daily Change % | -0.17 |
| 3 | Today daily open | 157.68 |
The pair remains strongly bullish on the daily timeframe. It trades above its 20 SMA @ 153.03, 50 SMA 150.48, 100 SMA @ 147.1 and 200 SMA @ 145.02.
| Trends | Trends.1 | |
|---|---|---|
| 0 | Daily SMA20 | 153.03 |
| 1 | Daily SMA50 | 150.48 |
| 2 | Daily SMA100 | 147.10 |
| 3 | Daily SMA200 | 145.02 |
The previous day high was 158.0 while the previous day low was 157.23. The daily 38.2% Fib levels comes at 157.52, expected to provide resistance. Similarly, the daily 61.8% fib level is at 157.71, expected to provide resistance.
Note the levels of interest below:
- Pivot support is noted at 157.27, 156.87, 156.5
- Pivot resistance is noted at 158.04, 158.4, 158.81
| Levels | Levels.1 |
|---|---|
| Previous Daily High | 158.00 |
| Previous Daily Low | 157.23 |
| Previous Weekly High | 156.93 |
| Previous Weekly Low | 154.05 |
| Previous Monthly High | 151.62 |
| Previous Monthly Low | 146.14 |
| Daily Fibonacci 38.2% | 157.52 |
| Daily Fibonacci 61.8% | 157.71 |
| Daily Pivot Point S1 | 157.27 |
| Daily Pivot Point S2 | 156.87 |
| Daily Pivot Point S3 | 156.50 |
| Daily Pivot Point R1 | 158.04 |
| Daily Pivot Point R2 | 158.40 |
| Daily Pivot Point R3 | 158.81 |
[/s2If]
Nehcap Expert Advisor
The NEHCAP MT4 EA is high quality professional trading system geared to generate returns without using GRID or martingales. Each trade has strict risk per trade parameter. The pairs under management include EURUSD, GBPUSD, AUDCAD, AUDNZD,GBPAUD, EURAUD, EURCAD, CHFJPY and many more.
The system is trading live: LIVE ACCOUNT TRACKING
You can run it free. Apply for a free trial and track our account. Buy the system or use profit share mechanism to generate returns on your MT4.
Join Our Telegram Group
")


