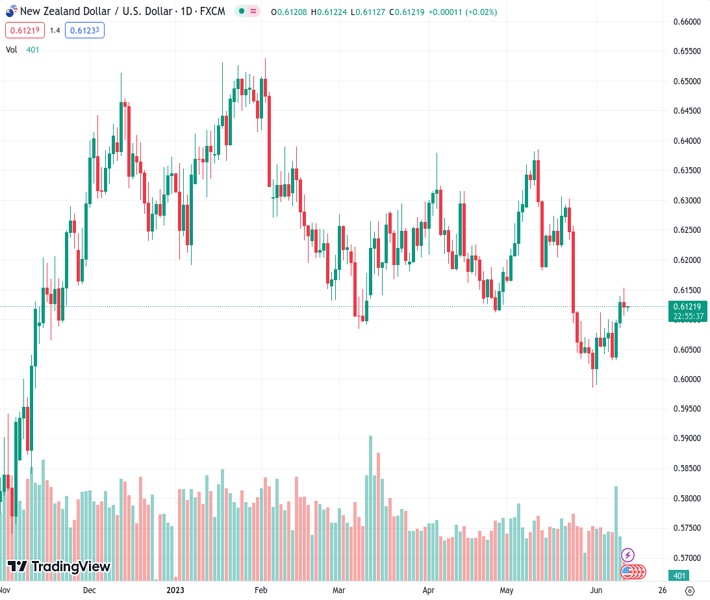
The NZDUSD pair encountered a significant obstacle at the 100-day Simple Moving Average level of 0.6150 and then withdrew to 0.6120.
…
This is a premium post.
[s2If !current_user_can(access_s2member_level4)]Please register for FREE REGISTER to read full post below containing analysis. In case of any error or you think you are not able to read the full post below, please email us at support#nehcap.com [lwa][/s2If] [s2If current_user_can(access_s2member_level1)]
- The NZD/USD faced strong resistance at the 100-day SMA of 0.6150 and retreated to 0.6120.
The pair currently trades last at 0.61217.
The previous day high was 0.6143 while the previous day low was 0.6084. The daily 38.2% Fib levels comes at 0.6121, expected to provide support. Similarly, the daily 61.8% fib level is at 0.6107, expected to provide support.
The NZD/USD was rejected at the 0.6150 level and the pair retraced to the 0.6120 area. As the market awaits significant economic data on Tuesday, visitor arrivals figures and the US Consumer Price Index (CPI) is expected to dominate investor sentiment and shape the trajectory of the currency pair in the short term.
As the tourist industry from New Zealand dominates a large total of its GDP, the Visitor’s Arrivals released by Stats NZ are closely watched by investors. The flow of tourists is expected to increase by 2.1% YoY in April, decelerating from the previous record in March.
Investors are eagerly awaiting the release of the US Consumer Price Index (CPI) data for May, as it is expected to provide crucial guidance for market direction. Analysts predict that the headline figure will reflect a slowdown in the year-on-year (YoY) rate to 4.1%, while the Core measure is projected to decrease from the previous YoY rate of 5.5% to 5.3%. In that sense, the inflation outlook is closely monitored by the Federal Reserve as one of its long-term objectives is to assure price stability.
Meanwhile, markets are expecting a hike pause for Wednesday’s meeting but a strong likelihood of 25 basis points in July. That being said, both Chair Powell’s press conference and the updated macroeconomic forecast of the Federal Open Market Committee will shape the expectations regarding the Federal Reserve’s (Fed) next moves.
According to the daily chart, the NZD/USD holds a neutral tilt with a bullish bias for the short term. Despite indicators losing some traction, there are still in positive territory, suggesting that there may be more upside potential.
Resistance Levels to watch: 0.6150,100-day Simple Moving Average (SMA), 0.6180, 0.6200.
Supports Levels to watch: 0.6125, 20-day Simple Moving Average (SMA), 0.6100, 0.6080.
Technical Levels: Supports and Resistances
NZDUSD currently trading at 0.6119 at the time of writing. Pair opened at 0.6143 and is trading with a change of -0.39 % .
| Overview | Overview.1 | |
|---|---|---|
| 0 | Today last price | 0.6119 |
| 1 | Today Daily Change | -0.0024 |
| 2 | Today Daily Change % | -0.3900 |
| 3 | Today daily open | 0.6143 |
The pair remains strongly bearish on the daily time frame. It trades below the 20 SMA @ 0.6125, 50 SMA 0.6188, 100 SMA @ 0.6234 and 200 SMA @ 0.6149.
| Trends | Trends.1 | |
|---|---|---|
| 0 | Daily SMA20 | 0.6125 |
| 1 | Daily SMA50 | 0.6188 |
| 2 | Daily SMA100 | 0.6234 |
| 3 | Daily SMA200 | 0.6149 |
The previous day high was 0.6143 while the previous day low was 0.6084. The daily 38.2% Fib levels comes at 0.6121, expected to provide support. Similarly, the daily 61.8% fib level is at 0.6107, expected to provide support.
Note the levels of interest below:
- Pivot support is noted at 0.6103, 0.6064, 0.6044
- Pivot resistance is noted at 0.6163, 0.6183, 0.6222
| Levels | Levels.1 |
|---|---|
| Previous Daily High | 0.6143 |
| Previous Daily Low | 0.6084 |
| Previous Weekly High | 0.6143 |
| Previous Weekly Low | 0.6026 |
| Previous Monthly High | 0.6385 |
| Previous Monthly Low | 0.5985 |
| Daily Fibonacci 38.2% | 0.6121 |
| Daily Fibonacci 61.8% | 0.6107 |
| Daily Pivot Point S1 | 0.6103 |
| Daily Pivot Point S2 | 0.6064 |
| Daily Pivot Point S3 | 0.6044 |
| Daily Pivot Point R1 | 0.6163 |
| Daily Pivot Point R2 | 0.6183 |
| Daily Pivot Point R3 | 0.6222 |
[/s2If]
Nehcap Expert Advisor
The NEHCAP MT4 EA is high quality professional trading system geared to generate returns without using GRID or martingales. Each trade has strict risk per trade parameter. The pairs under management include EURUSD, GBPUSD, AUDCAD, AUDNZD,GBPAUD, EURAUD, EURCAD, CHFJPY and many more.
The system is trading live: LIVE ACCOUNT TRACKING
You can run it free. Apply for a free trial and track our account. Buy the system or use profit share mechanism to generate returns on your MT4.
Join Our Telegram Group
")


