#USDJPY @ 139.419 picks up bids to snap three-day downtrend, stays within bullish chart formation., @nehcap view: Further upside expected (Pivot Orderbook analysis)
…
This is a premium post.
[s2If !current_user_can(access_s2member_level4)]Please register for FREE REGISTER to read full post below containing analysis. In case of any error or you think you are not able to read the full post below, please email us at support#nehcap.com [lwa][/s2If] [s2If current_user_can(access_s2member_level1)]
- USD/JPY picks up bids to snap three-day downtrend, stays within bullish chart formation.
- RSI rebound adds strength to the upside bias but bearish MACD signals, 139.80 hurdle prod Yen pair bulls.
- Multiple supports, recently upbeat market sentiment challenge Yen buyers.
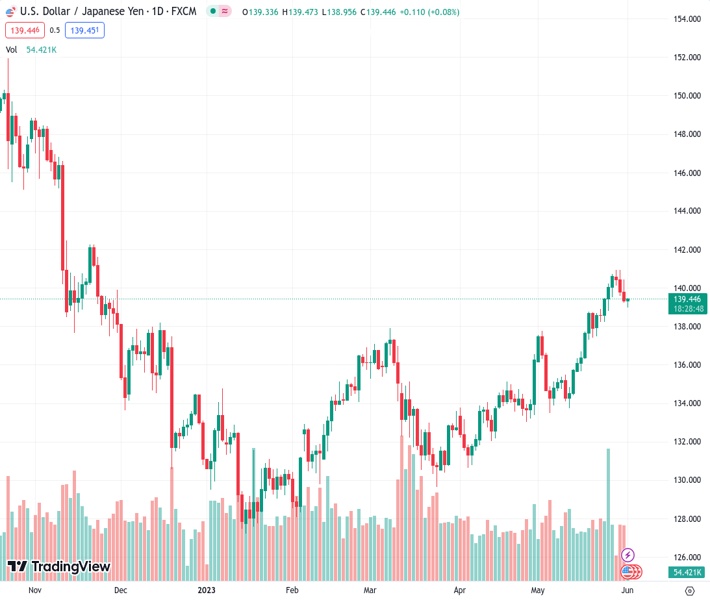
The pair currently trades last at 139.419.
The previous day high was 140.43 while the previous day low was 139.24. The daily 38.2% Fib levels comes at 139.69, expected to provide resistance. Similarly, the daily 61.8% fib level is at 139.97, expected to provide resistance.
USD/JPY picks up bids to refresh its intraday high near 139.50 as it prints the first daily gains in four during early Thursday. In doing so, the Yen pair recovers from the bottom line of a short-term bull flag formation.
That said, the RSI (14) line’s rebound from the below-50 region seems to underpin the USD/JPY pair’s latest recovery moves within the flag. However, the 50-SMA hurdle of near 139.50 joins the bearish MACD signals to challenge the bulls.
In a case where the USD/JPY pair manages to cross the 139.50 hurdle, the stated flag’s top-line surrounding 139.80 will be eyed closely as a break of which will confirm the bullish chart formation suggesting a theoretical target of around 146.50.
However, the 140.00 round figure and the yearly high marked on Monday near 140.45 can challenge the USD/JPY buyers before giving them control.
Also acting as an upside filter below 146.50 is the November 2022 high of near 142.25 and the last September’s peak of 145.90.
On the flip side, a clear break of the 139.00 immediate support will defy the bullish chart formation and can drag the USD/JPY price towards the mid-May swing high of near 138.75.
Following that, the 100-SMA level of near 137.85 may act as the last defense of the USD/JPY buyers.
Trend: Further upside expected
Technical Levels: Supports and Resistances
USDJPY currently trading at 139.39 at the time of writing. Pair opened at 139.34 and is trading with a change of 0.04% % .
| Overview | Overview.1 | |
|---|---|---|
| 0 | Today last price | 139.39 |
| 1 | Today Daily Change | 0.05 |
| 2 | Today Daily Change % | 0.04% |
| 3 | Today daily open | 139.34 |
The pair remains strongly bullish on the daily timeframe. It trades above its 20 SMA @ 137.38, 50 SMA 134.97, 100 SMA @ 133.74 and 200 SMA @ 137.27.
| Trends | Trends.1 | |
|---|---|---|
| 0 | Daily SMA20 | 137.38 |
| 1 | Daily SMA50 | 134.97 |
| 2 | Daily SMA100 | 133.74 |
| 3 | Daily SMA200 | 137.27 |
The previous day high was 140.43 while the previous day low was 139.24. The daily 38.2% Fib levels comes at 139.69, expected to provide resistance. Similarly, the daily 61.8% fib level is at 139.97, expected to provide resistance.
Note the levels of interest below:
- Pivot support is noted at 138.91, 138.48, 137.72
- Pivot resistance is noted at 140.1, 140.86, 141.29
| Levels | Levels.1 |
|---|---|
| Previous Daily High | 140.43 |
| Previous Daily Low | 139.24 |
| Previous Weekly High | 140.72 |
| Previous Weekly Low | 137.49 |
| Previous Monthly High | 140.93 |
| Previous Monthly Low | 133.50 |
| Daily Fibonacci 38.2% | 139.69 |
| Daily Fibonacci 61.8% | 139.97 |
| Daily Pivot Point S1 | 138.91 |
| Daily Pivot Point S2 | 138.48 |
| Daily Pivot Point S3 | 137.72 |
| Daily Pivot Point R1 | 140.10 |
| Daily Pivot Point R2 | 140.86 |
| Daily Pivot Point R3 | 141.29 |
[/s2If]
Nehcap Expert Advisor
The NEHCAP MT4 EA is high quality professional trading system geared to generate returns without using GRID or martingales. Each trade has strict risk per trade parameter. The pairs under management include EURUSD, GBPUSD, AUDCAD, AUDNZD,GBPAUD, EURAUD, EURCAD, CHFJPY and many more.
The system is trading live: LIVE ACCOUNT TRACKING
You can run it free. Apply for a free trial and track our account. Buy the system or use profit share mechanism to generate returns on your MT4.
Join Our Telegram Group
")


