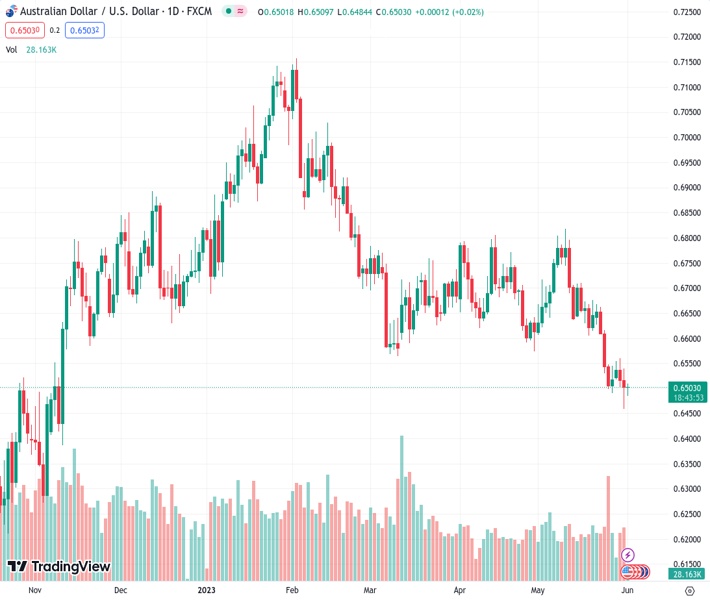
#AUDUSD @ 0.65041 has pushed its recovery above 0.6500 after better than anticipated Caixin manufacturing PMI. (Pivot Orderbook analysis)
…
This is a premium post.
[s2If !current_user_can(access_s2member_level4)]Please register for FREE REGISTER to read full post below containing analysis. In case of any error or you think you are not able to read the full post below, please email us at support#nehcap.com [lwa][/s2If] [s2If current_user_can(access_s2member_level1)]
- AUD/USD has pushed its recovery above 0.6500 after better than anticipated Caixin manufacturing PMI.
- The release of the Caixin Manufacturing PMI is widely diverged from China’s official Manufacturing PMI data.
- Higher expectations for one more interest rate hike from the Fed could keep the USD index in good shape.
The pair currently trades last at 0.65041.
The previous day high was 0.654 while the previous day low was 0.6458. The daily 38.2% Fib levels comes at 0.6489, expected to provide support. Similarly, the daily 61.8% fib level is at 0.6509, expected to provide resistance.
The AUD/USD pair has attempted a recovery move as the IHS Markit has reported upbeat Caixin Manufacturing PMI (May) data. The economic data has landed at 50.9, higher than the consensus and the prior release of 49.5. A figure above 50.0 bifurcates expansion and contraction phases and Chinese factory activities have landed in expansionary territory.
The release of the Caixin Manufacturing PMI is widely diverged from China’s official Manufacturing PMI data. On Wednesday, China’s National Bureau of Statistics (NBS) reported Manufacturing PMI at 48.8, lower than the estimates of 49.4 and the former release of 49.2.
Investors should note that Australia is the leading trading partner of China and higher Chinese factory activity data supports the Australian Dollar.
The Australian Dollar witnessed a sell-off on Wednesday despite posting higher-than-anticipated inflation data. The monthly Australian Consumer Price Index (CPI) soared to 6.8% vs. estimates of 6.4% and the former release of 6.3%. A rebound in Australian inflationary pressures might force the Reserve Bank of Australia (RBA) to announce one more interest rate hike by 25 basis points (bps) in June and push the Official Cash Rate (OCR) above 4%.
Meanwhile, S&P500 futures have surrendered their entire losses posted in early Asia. The risk profile has turned depressed as investors are shifting their focus back to the United States Employment data post clearance of the US debt-ceiling bill in Congress.
Going forward, US Nonfarm Payrolls (NFP) data (May) will keep investors busy. As per the preliminary report, fresh 190K payrolls were added in the labor market in May, lower than the additions of 253K made in April. The Unemployment Rate increased to 3.5% vs. the former release of 3.4%. Annual Average Hourly Earnings were seen steady at 4.4%.
The US Dollar Index (DXY) has sensed selling pressure while extending its recovery above 104.30. Higher expectations for one more interest rate hike from the Federal Reserve (Fed) could keep the USD index in good shape.
Technical Levels: Supports and Resistances
AUDUSD currently trading at 0.6486 at the time of writing. Pair opened at 0.6503 and is trading with a change of -0.26 % .
| Overview | Overview.1 | |
|---|---|---|
| 0 | Today last price | 0.6486 |
| 1 | Today Daily Change | -0.0017 |
| 2 | Today Daily Change % | -0.2600 |
| 3 | Today daily open | 0.6503 |
The pair remains strongly bearish on the daily time frame. It trades below the 20 SMA @ 0.6639, 50 SMA 0.6667, 100 SMA @ 0.6762 and 200 SMA @ 0.6698.
| Trends | Trends.1 | |
|---|---|---|
| 0 | Daily SMA20 | 0.6639 |
| 1 | Daily SMA50 | 0.6667 |
| 2 | Daily SMA100 | 0.6762 |
| 3 | Daily SMA200 | 0.6698 |
The previous day high was 0.654 while the previous day low was 0.6458. The daily 38.2% Fib levels comes at 0.6489, expected to provide support. Similarly, the daily 61.8% fib level is at 0.6509, expected to provide resistance.
Note the levels of interest below:
- Pivot support is noted at 0.6461, 0.6419, 0.6379
- Pivot resistance is noted at 0.6542, 0.6582, 0.6624
| Levels | Levels.1 |
|---|---|
| Previous Daily High | 0.6540 |
| Previous Daily Low | 0.6458 |
| Previous Weekly High | 0.6668 |
| Previous Weekly Low | 0.6490 |
| Previous Monthly High | 0.6818 |
| Previous Monthly Low | 0.6458 |
| Daily Fibonacci 38.2% | 0.6489 |
| Daily Fibonacci 61.8% | 0.6509 |
| Daily Pivot Point S1 | 0.6461 |
| Daily Pivot Point S2 | 0.6419 |
| Daily Pivot Point S3 | 0.6379 |
| Daily Pivot Point R1 | 0.6542 |
| Daily Pivot Point R2 | 0.6582 |
| Daily Pivot Point R3 | 0.6624 |
[/s2If]
Nehcap Expert Advisor
The NEHCAP MT4 EA is high quality professional trading system geared to generate returns without using GRID or martingales. Each trade has strict risk per trade parameter. The pairs under management include EURUSD, GBPUSD, AUDCAD, AUDNZD,GBPAUD, EURAUD, EURCAD, CHFJPY and many more.
The system is trading live: LIVE ACCOUNT TRACKING
You can run it free. Apply for a free trial and track our account. Buy the system or use profit share mechanism to generate returns on your MT4.
Join Our Telegram Group
")


