Oil price spirals lower as traders deleverage ahead of the key vote to decide whether the US should raise its debt limit.
…
This is a premium post.
[s2If !current_user_can(access_s2member_level4)]Please register for FREE REGISTER to read full post below containing analysis. In case of any error or you think you are not able to read the full post below, please email us at support#nehcap.com [lwa][/s2If] [s2If current_user_can(access_s2member_level1)]
- Oil price spirals lower as traders deleverage ahead of the key vote to decide whether the US should raise its debt limit.
- A growing number of Republican Congressmen especially, have voiced their disapproval of the deal and said they intend to vote it down.
- Mixed messaging from key OPEC+ members ahead of the June 4 meeting adds to the uncertainty.
Oil price tumbles on Wednesday as doubts grow over whether the deal to raise the US debt ceiling will get voted through by Congress. A group of rebel Republicans and some Democrats too have warned they may vote against the deal. If it fails to pass and the US defaults on its obligations, financial chaos is expected, hitting Oil demand and lowering prices. That said, the US Dollar could also suffer – a positive for Oil, which is priced mainly in USD. Uncertainty over the outcome of OPEC+’s next meeting and mixed messaging from key members adds to the opaque outlook.
At the time of writing, WTI Oil is trading in the upper $67s and Brent Crude Oil in the lower $72s.
WTI Oil price paints more red on the charts as it falls back in line with the dominant downtrend, which has made successive lower lows since July 2022. As the old adage goes, “the trend is your friend until the bend at the end,” which given it is bearish favors short sellers. WTI Oil is trading below all the major daily and weekly Simple Moving Averages (SMAs) and is now also testing the 200-week SMA at $66.90.
WTI US Oil: Weekly Chart
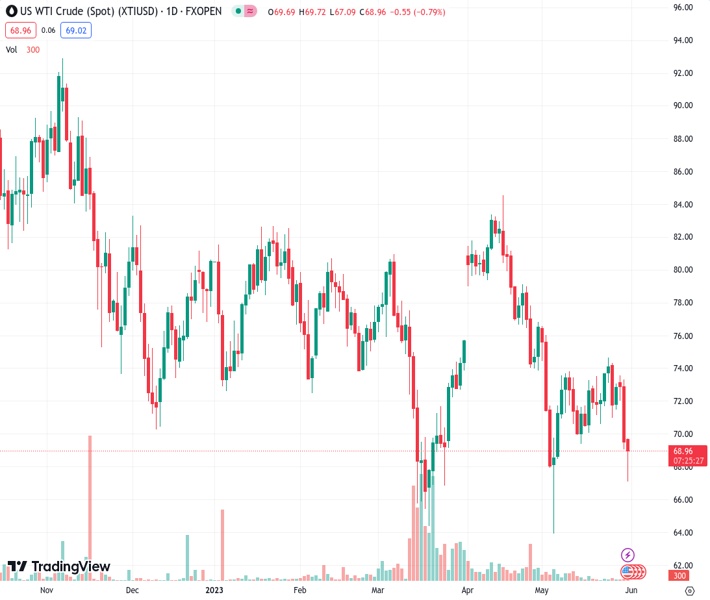
The potentially bullish right-angled triangle, which formed during May and is shown by the dotted lines on the daily chart below, failed to breakout higher and instead broke lower.
WTI US Oil: Daily Chart
Oil price has decisively broken below the May 22 lows of $70.65 as well as the $69.40 May 15 lows. Only the 200-week SMA now stands in the way of further losses. If it breaks too, it could lead to further weakness down to the year-to-date (YTD) lows of $64.31.
A break below the YTD lows would reignite the downtrend, with the next target at around $62.00, where trough lows from 2021 will come into play, followed by support at $57.50.
Oil price needs to climb back above the $74.70 May 24 highs to raise doubts about the dominant bearish trend.
Such a break might lead to a potential target in the $79.70s, which roughly coincides with the 200-day SMA and the main trendline for the bear market, heightening its importance as a key resistance level.
The long hammer Japanese candlestick pattern that formed at the May 4 (and YTD) lows is a sign that Oil price may have formed a strategic bottom at that level.
[/s2If]
Nehcap Expert Advisor
The NEHCAP MT4 EA is high quality professional trading system geared to generate returns without using GRID or martingales. Each trade has strict risk per trade parameter. The pairs under management include EURUSD, GBPUSD, AUDCAD, AUDNZD,GBPAUD, EURAUD, EURCAD, CHFJPY and many more.
The system is trading live: LIVE ACCOUNT TRACKING
You can run it free. Apply for a free trial and track our account. Buy the system or use profit share mechanism to generate returns on your MT4.
Join Our Telegram Group
")


