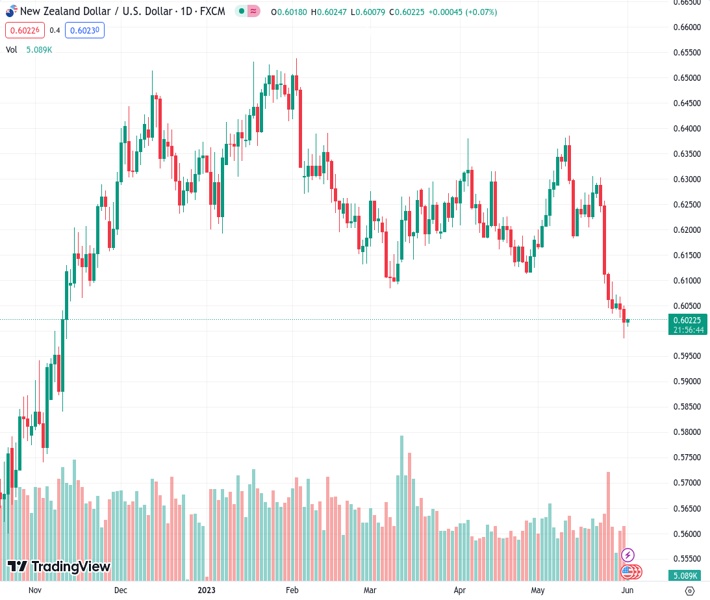
#NZDUSD @ 0.60234 fades bounce off three-month-old descending support line, stays pressured at the lowest levels since November 2022., @nehcap view: Limited downside expected (Pivot Orderbook analysis)
…
This is a premium post.
[s2If !current_user_can(access_s2member_level4)]Please register for FREE REGISTER to read full post below containing analysis. In case of any error or you think you are not able to read the full post below, please email us at support#nehcap.com [lwa][/s2If] [s2If current_user_can(access_s2member_level1)]
- NZD/USD fades bounce off three-month-old descending support line, stays pressured at the lowest levels since November 2022.
- Oversold RSI backs corrective bounce off the key support but bearish MACD signals turn down recovery hopes.
- Convergence of 200-DMA, 38.2% Fibonacci retracement restricts short-term upside.
- US ADP Employment Change, multiple PMIs eyed for clear directions.
The pair currently trades last at 0.60234.
The previous day high was 0.6067 while the previous day low was 0.6025. The daily 38.2% Fib levels comes at 0.6041, expected to provide resistance. Similarly, the daily 61.8% fib level is at 0.6051, expected to provide resistance.
NZD/USD fades bounce off a three-month-old key support line while dropping back to 0.6015 during early Thursday in Asia.
In doing so, the Kiwi pair justifies the bearish MACD signals to extend the previous week’s downside break of the 200-DMA while keeping the bears in the driver’s seat at the lowest levels in seven months. It’s worth noting, however, that the RSI (14) line is almost oversold and hence can offer intermediate bounces during the south-run.
With this, the NZD/USD price may again test the aforementioned support line stretched from March, close to 0.5980 by the press time. However, the quote’s further downside appears elusive.
In a case where the Kiwi pair breaks the stated support line, it can quickly drop to the 61.8% Fibonacci retracement level of October 2022 to February 2023 upside, near 0.5900.
On the other hand, recovery remains unimpressive below an upward-sloping previous support line from mid-November 2022, surrounding 0.6100.
Even so, the NZD/USD pair buyers remain off the table unless witnessing a daily closing beyond a convergence of the 200-DMA and 38.2% Fibonacci retracement, near 0.6150.
Trend: Limited downside expected
Technical Levels: Supports and Resistances
NZDUSD currently trading at 0.6019 at the time of writing. Pair opened at 0.6044 and is trading with a change of -0.41% % .
| Overview | Overview.1 | |
|---|---|---|
| 0 | Today last price | 0.6019 |
| 1 | Today Daily Change | -0.0025 |
| 2 | Today Daily Change % | -0.41% |
| 3 | Today daily open | 0.6044 |
The pair remains strongly bearish on the daily time frame. It trades below the 20 SMA @ 0.6213, 50 SMA 0.6214, 100 SMA @ 0.626 and 200 SMA @ 0.6152.
| Trends | Trends.1 | |
|---|---|---|
| 0 | Daily SMA20 | 0.6213 |
| 1 | Daily SMA50 | 0.6214 |
| 2 | Daily SMA100 | 0.6260 |
| 3 | Daily SMA200 | 0.6152 |
The previous day high was 0.6067 while the previous day low was 0.6025. The daily 38.2% Fib levels comes at 0.6041, expected to provide resistance. Similarly, the daily 61.8% fib level is at 0.6051, expected to provide resistance.
Note the levels of interest below:
- Pivot support is noted at 0.6024, 0.6003, 0.5982
- Pivot resistance is noted at 0.6066, 0.6087, 0.6108
| Levels | Levels.1 |
|---|---|
| Previous Daily High | 0.6067 |
| Previous Daily Low | 0.6025 |
| Previous Weekly High | 0.6303 |
| Previous Weekly Low | 0.6032 |
| Previous Monthly High | 0.6389 |
| Previous Monthly Low | 0.6111 |
| Daily Fibonacci 38.2% | 0.6041 |
| Daily Fibonacci 61.8% | 0.6051 |
| Daily Pivot Point S1 | 0.6024 |
| Daily Pivot Point S2 | 0.6003 |
| Daily Pivot Point S3 | 0.5982 |
| Daily Pivot Point R1 | 0.6066 |
| Daily Pivot Point R2 | 0.6087 |
| Daily Pivot Point R3 | 0.6108 |
[/s2If]
Nehcap Expert Advisor
The NEHCAP MT4 EA is high quality professional trading system geared to generate returns without using GRID or martingales. Each trade has strict risk per trade parameter. The pairs under management include EURUSD, GBPUSD, AUDCAD, AUDNZD,GBPAUD, EURAUD, EURCAD, CHFJPY and many more.
The system is trading live: LIVE ACCOUNT TRACKING
You can run it free. Apply for a free trial and track our account. Buy the system or use profit share mechanism to generate returns on your MT4.
Join Our Telegram Group
")


