US Dollar Index remains sidelined after refreshing two-month high. (Pivot Orderbook analysis)
…
This is a premium post.
[s2If !current_user_can(access_s2member_level4)]Please register for FREE REGISTER to read full post below containing analysis. In case of any error or you think you are not able to read the full post below, please email us at support#nehcap.com [lwa][/s2If] [s2If current_user_can(access_s2member_level1)]
- US Dollar Index remains sidelined after refreshing two-month high.
- Hawkish Fed bets, risk-off mood allows DXY to remain firmer despite pullback in yields.
- Upbeat US PMIs, concerns about Fed’s next move highlight today’s Minutes.
- US policymakers struggle to overcome the deadlock in debt ceiling talks ahead of early June expiry.
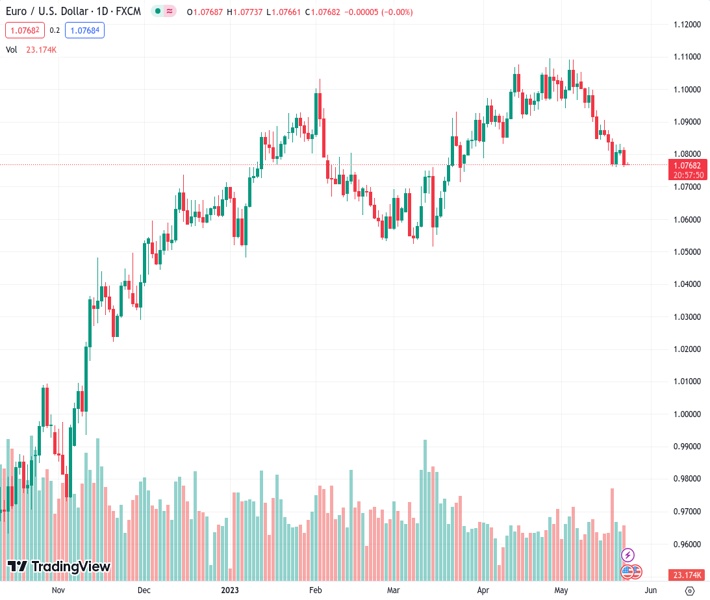
The pair currently trades last at 103.53.
The previous day high was 103.37 while the previous day low was 102.96. The daily 38.2% Fib levels comes at 103.21, expected to provide support. Similarly, the daily 61.8% fib level is at 103.12, expected to provide support.
US Dollar Index (DXY) bulls take a breather at a nine-week high, making rounds to 103.50 as traders await the latest Federal Open Market Committee (FOMC) Meeting Minutes. Also challenging the greenback’s gauge versus six major currencies are the fears of the US default. However, hawkish Federal Reserve (Fed) concerns and upbeat US data put a floor under the DXY price during early Wednesday.
A lack of progress in the talks to avoid the US debt ceiling expiration and fears that the US may mark the ‘catastrophic’ default weighed on the market sentiment of late. Recently, US House Speaker Kevin McCarthy crossed wires, via Reuters, while suggesting no deal on the debt ceiling extension today but repeating previous optimism that they will get an agreement before June 01. Previously, Washington rolled out news stating the US Treasury has asked multiple agencies if they can delay the payment demands.
Talking about the data, preliminary figures of the May monthly PMIs signaled that the US Services sector keeps outgrowing the manufacturing ones and fuelled the Composite PMI figure to the highest levels in a year. That said, the US S&P Global Manufacturing PMI eased to 48.5 from 50.2 versus 50.0 market forecasts whereas Sevices PMI rose to 55.1 compared to 52.6 expected and 53.6. With this, the Composite PMI marked 54.5 figures versus the analysts’ expectations of 50.0 and 53.4.
On the other hand, the latest comments from Atlanta Fed President Raphael Bostic, Richmond Fed President Thomas Barkin and San Francisco President Mary C Daly who backed the calls for higher Fed rates while citing the inflation woes, which in turn propelled the betts on the Fed rate increase in June. The same push back the Fed rate cut and allows the US Dollar to remain firmer despite a retreat in the US Treasury bond yields. It should be noted that the US 10-year and two-year Treasury bond yields retreated from the highest levels since early March the previous day.
With this, the Wall Street benchmarks saw the red but the S&P 500 Futures seem to struggle for clear directions, marking mild gains of late.
Looking ahead, the qualitative factors affecting the market sentiment, like US debt ceiling talks, US-China tension and Fed commentary, are the key catalysts to direct short-term US Dollar Index moves ahead of the Fed Minutes.
Also read: FOMC Minutes Preview: The complicated task of searching for clues
Unless providing a daily close below the 100-DMA, around 102.85 by the press time, US Dollar Index remains on the buyer’s radar.
Technical Levels: Supports and Resistances
EURUSD currently trading at 103.53 at the time of writing. Pair opened at 103.25 and is trading with a change of 0.27% % .
| Overview | Overview.1 | |
|---|---|---|
| 0 | Today last price | 103.53 |
| 1 | Today Daily Change | 0.28 |
| 2 | Today Daily Change % | 0.27% |
| 3 | Today daily open | 103.25 |
The pair is trading above its 20 Daily moving average @ 102.09, above its 50 Daily moving average @ 102.3 , above its 100 Daily moving average @ 102.89 and below its 200 Daily moving average @ 105.69
| Trends | Trends.1 | |
|---|---|---|
| 0 | Daily SMA20 | 102.09 |
| 1 | Daily SMA50 | 102.30 |
| 2 | Daily SMA100 | 102.89 |
| 3 | Daily SMA200 | 105.69 |
The previous day high was 103.37 while the previous day low was 102.96. The daily 38.2% Fib levels comes at 103.21, expected to provide support. Similarly, the daily 61.8% fib level is at 103.12, expected to provide support.
Note the levels of interest below:
- Pivot support is noted at 103.01, 102.78, 102.61
- Pivot resistance is noted at 103.42, 103.6, 103.83
| Levels | Levels.1 |
|---|---|
| Previous Daily High | 103.37 |
| Previous Daily Low | 102.96 |
| Previous Weekly High | 103.63 |
| Previous Weekly Low | 102.20 |
| Previous Monthly High | 103.06 |
| Previous Monthly Low | 100.79 |
| Daily Fibonacci 38.2% | 103.21 |
| Daily Fibonacci 61.8% | 103.12 |
| Daily Pivot Point S1 | 103.01 |
| Daily Pivot Point S2 | 102.78 |
| Daily Pivot Point S3 | 102.61 |
| Daily Pivot Point R1 | 103.42 |
| Daily Pivot Point R2 | 103.60 |
| Daily Pivot Point R3 | 103.83 |
[/s2If]
Nehcap Expert Advisor
The NEHCAP MT4 EA is high quality professional trading system geared to generate returns without using GRID or martingales. Each trade has strict risk per trade parameter. The pairs under management include EURUSD, GBPUSD, AUDCAD, AUDNZD,GBPAUD, EURAUD, EURCAD, CHFJPY and many more.
The system is trading live: LIVE ACCOUNT TRACKING
You can run it free. Apply for a free trial and track our account. Buy the system or use profit share mechanism to generate returns on your MT4.
Join Our Telegram Group
")


