Oil price continues to rally after Saudi Prince Abdulaziz bin Salman, the country’s Oil minister, warns short-sellers to “watch out”.
…
This is a premium post.
[s2If !current_user_can(access_s2member_level4)]Please register for FREE REGISTER to read full post below containing analysis. In case of any error or you think you are not able to read the full post below, please email us at support#nehcap.com [lwa][/s2If] [s2If current_user_can(access_s2member_level1)]
- Oil price continues to rally after Saudi Prince Abdulaziz bin Salman, the country’s Oil minister, warns short-sellers to “watch out”.
- Inventory data shows a steep drawdown in the prior week, reflecting rising demand ahead of US driving season.
- A bullish triangle pattern forms on the 4-hour chart, increasing the evidence the bearish trend may be reversing.
- EIA inventory data to be released soon could provide volatility.
Oil price trades roughly a percentage point higher on Wednesday after data from the US showed a dramatic fall in Oil inventories, indicating rising demand. The Oil price was given a further lift after the Saudi Oil Minister warned Oil short-sellers to “watch out” ahead of the OPEC+ meeting on June 4.
At the time of writing, WTI Oil is trading around $74 and Brent Crude Oil in the upper $77s. A bullish right-angled triangle has completed on the 4-hour chart, posing a challenge to the overall bear trend.
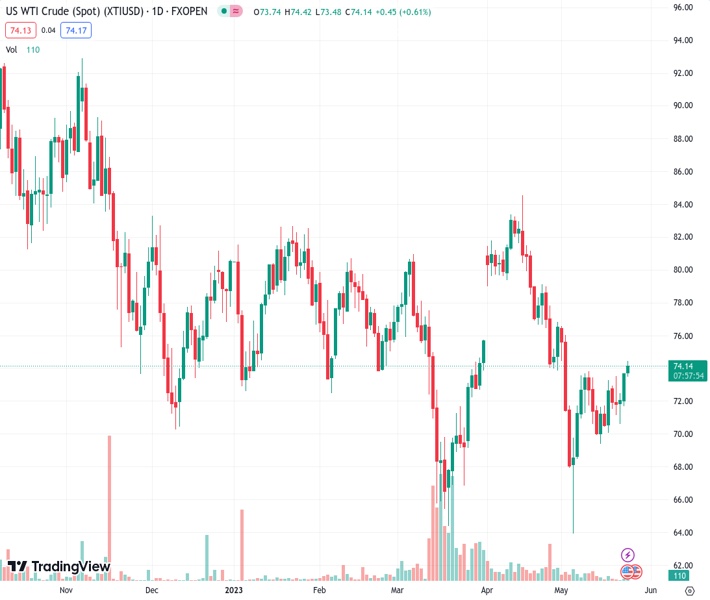
WTI Oil is in a long-term downtrend from a technical perspective, making successive lower lows. Given the old adage that the trend is your friend, this favors short positions over long positions. WTI Oil is trading below all the major daily Simple Moving Averages (SMA) and all the weekly SMAs except the 200-week which is at $66.89.
WTI US Oil: Daily Chart
A break below the year-to-date (YTD) lows of $64.31 would be required to re-ignite the downtrend, with the next target at around $62.00 where trough lows from 2021 will come into play, followed by support at $57.50.
Despite the bearish trend dominating, there are growing signs pointing to a possible conclusion and reversal. The mild bullish convergence between price and the Relative Strength Index (RSI) at the March and May 2023 lows – with price making a lower low in May that is not matched by a lower low in RSI – is a sign that bearish pressure is easing.
The long hammer Japanese candlestick pattern that formed at the May 4 (and year-to-date) lows is a sign that it could be a key strategic bottom.
Further, a right-angled triangle has formed on the 4-hour chart below (drawn in dotted lines), which because of its shape is biased to breakout higher.
WTI US Oil: 4-hour Chart
The triangle formed after price recovered from the May 4 YTD lows. The initial rebound off the May 4 lows could be a Wave A, with Wave B descending between May 8-15. Wave C then probably rose in the week that followed and then pulled back in a Wave D. This week’s recovery is probably a Wave E. Since most triangles are only composed of five waves this one is now probably complete. It could break out at any moment.
There is a chance the triangle might break in either direction, but it is biased to break higher because the top border is flat (it is right angled). A breakout higher could see price rise in a volatile rally to a potential target of $79.75, calculated by using the usual technical method, which is to take 61.8% the height of the triangle and extrapolate it from the breakout point higher. Oil price could even go as far as a 100% extrapolation in bullish cases, however, the 61.8% level coincides with the 200-day SMA, heightening its importance as a key resistance level.
Such a break and assuming Oil price reaches its target would mean price breaking above the $76.85 lower high of April 28, thereby, bringing the dominant bear trend into doubt.
False breaks are common with this pattern, however, and traders should ideally wait for a ‘decisive’ break. Such a break is characterized by a longer-than-average bullish green bar which pierces completely through the upper borderline of the triangle and closes near the 4-hour period’s highs, or alternatively three green bars in a row that also pierce above the borderline.
The RSI on the 4-hour chart is also showing a mild bearish divergence between the tops of Waves C and E and RSI. Whilst price has climbed higher in Wave E, RSI has not followed suit and remains beneath the level it was at when Wave C peaked. This suggests waning bullish interest although given it is mild, there is still a possibility of a breakout if momentum suddenly picks up.
Given the downtrend is dominant there is still also a possibility WTI Oil price could break lower, with a decisive break below the lower border, likewise required, and a target at $67.27. This is just above where the 200-week SMA is located and likely to offer support. Traders might even wish to wait for a break below the lows of Wave B at $69.40 for added confirmation.
[/s2If]
Nehcap Expert Advisor
The NEHCAP MT4 EA is high quality professional trading system geared to generate returns without using GRID or martingales. Each trade has strict risk per trade parameter. The pairs under management include EURUSD, GBPUSD, AUDCAD, AUDNZD,GBPAUD, EURAUD, EURCAD, CHFJPY and many more.
The system is trading live: LIVE ACCOUNT TRACKING
You can run it free. Apply for a free trial and track our account. Buy the system or use profit share mechanism to generate returns on your MT4.
Join Our Telegram Group
")


