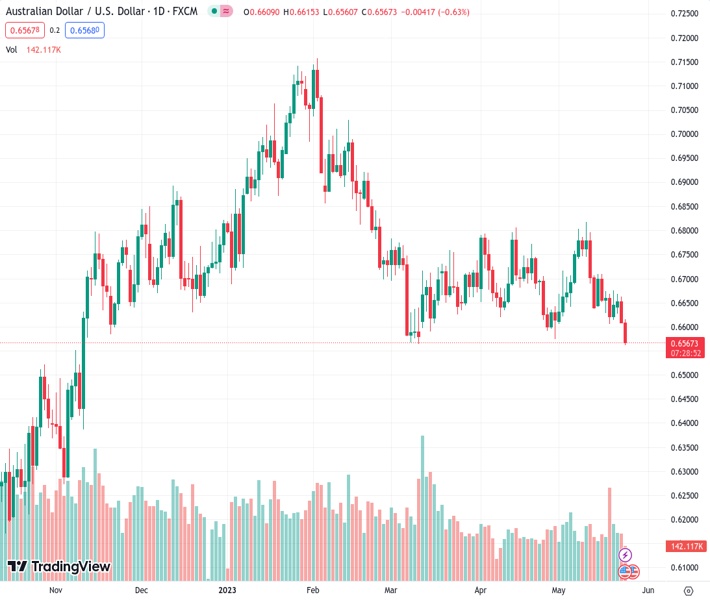
#AUDUSD @ 0.65706 drifts lower for the second straight day and drops to a fresh YTD low on Wednesday. (Pivot Orderbook analysis)
…
This is a premium post.
[s2If !current_user_can(access_s2member_level4)]Please register for FREE REGISTER to read full post below containing analysis. In case of any error or you think you are not able to read the full post below, please email us at support#nehcap.com [lwa][/s2If] [s2If current_user_can(access_s2member_level1)]
- AUD/USD drifts lower for the second straight day and drops to a fresh YTD low on Wednesday.
- Looming recession risks weigh on investors’ sentiment and undermine the risk-sensitive Aussie.
- Retreating US bond yields cap gains for the USD and lends support ahead of the FOMC minutes.
The pair currently trades last at 0.65706.
The previous day high was 0.6662 while the previous day low was 0.6607. The daily 38.2% Fib levels comes at 0.6628, expected to provide resistance. Similarly, the daily 61.8% fib level is at 0.6641, expected to provide resistance.
The AUD/USD pair remains under heavy selling pressure for the second successive day and drops to the 0.6560 area, its lowest level since November 2022 during the early North American session.
Worries over slowing global growth, particularly in China, along with the lack of progress in talks over increasing the US debt ceiling, continue to weigh on investors’ sentiment and turn out to be a key factor weighing on the Australian Dollar (AUD). In fact, data from China last week indicated that the world’s second-largest economy underperformed in April. Furthermore, Representatives of President Joe Biden and congressional Republicans ended another round of debt ceiling talks without an agreement to raise the government’s $31.4 trillion borrowing limit. This, along with speculations that the Reserve Bank of Australia (RBA) might refrain from hiking in June, exerts additional downward pressure on the perceived riskier Aussie.
The US Dollar (USD), on the other hand, consolidates its recent gains to a two-month low and remains well supported by firming expectations that the Federal Reserve (Fed) will keep interest rates higher for longer. In fact, the markets have started pricing in the possibility of another 25 bps lift-off at the next policy meeting in June and the bets were lifted by the recent hawkish remarks by a slew of influential Fed officials. That said, the ongoing retracement slide in the US Treasury bond yields is holding back the USD bulls from placing aggressive bets and helping limit the downside for the AUD/USD pair. Investors also seem reluctant and prefer to wait on the sidelines ahead of the release of the FOMC meeting minutes, due later during the US session.
The minutes will be closely scrutinized for clues about the Fed’s future rate-hike path, which, in turn, will play a key role in influencing the near-term USD price dynamics and provide a fresh directional impetus to the AUD/USD pair. Nevertheless, the aforementioned fundamental backdrop suggests that the path of least resistance for the major is to the downside and any attempted recovery might still get sold into. Spot prices now seem vulnerable to weaken further towards testing the next relevant support near the 0.6500 psychological mark.
Technical Levels: Supports and Resistances
AUDUSD currently trading at 0.6574 at the time of writing. Pair opened at 0.661 and is trading with a change of -0.54 % .
| Overview | Overview.1 | |
|---|---|---|
| 0 | Today last price | 0.6574 |
| 1 | Today Daily Change | -0.0036 |
| 2 | Today Daily Change % | -0.5400 |
| 3 | Today daily open | 0.6610 |
The pair remains strongly bearish on the daily time frame. It trades below the 20 SMA @ 0.6674, 50 SMA 0.6685, 100 SMA @ 0.6783 and 200 SMA @ 0.671.
| Trends | Trends.1 | |
|---|---|---|
| 0 | Daily SMA20 | 0.6674 |
| 1 | Daily SMA50 | 0.6685 |
| 2 | Daily SMA100 | 0.6783 |
| 3 | Daily SMA200 | 0.6710 |
The previous day high was 0.6662 while the previous day low was 0.6607. The daily 38.2% Fib levels comes at 0.6628, expected to provide resistance. Similarly, the daily 61.8% fib level is at 0.6641, expected to provide resistance.
Note the levels of interest below:
- Pivot support is noted at 0.6591, 0.6572, 0.6536
- Pivot resistance is noted at 0.6645, 0.6681, 0.67
| Levels | Levels.1 |
|---|---|
| Previous Daily High | 0.6662 |
| Previous Daily Low | 0.6607 |
| Previous Weekly High | 0.6710 |
| Previous Weekly Low | 0.6605 |
| Previous Monthly High | 0.6806 |
| Previous Monthly Low | 0.6574 |
| Daily Fibonacci 38.2% | 0.6628 |
| Daily Fibonacci 61.8% | 0.6641 |
| Daily Pivot Point S1 | 0.6591 |
| Daily Pivot Point S2 | 0.6572 |
| Daily Pivot Point S3 | 0.6536 |
| Daily Pivot Point R1 | 0.6645 |
| Daily Pivot Point R2 | 0.6681 |
| Daily Pivot Point R3 | 0.6700 |
[/s2If]
Nehcap Expert Advisor
The NEHCAP MT4 EA is high quality professional trading system geared to generate returns without using GRID or martingales. Each trade has strict risk per trade parameter. The pairs under management include EURUSD, GBPUSD, AUDCAD, AUDNZD,GBPAUD, EURAUD, EURCAD, CHFJPY and many more.
The system is trading live: LIVE ACCOUNT TRACKING
You can run it free. Apply for a free trial and track our account. Buy the system or use profit share mechanism to generate returns on your MT4.
Join Our Telegram Group
")


