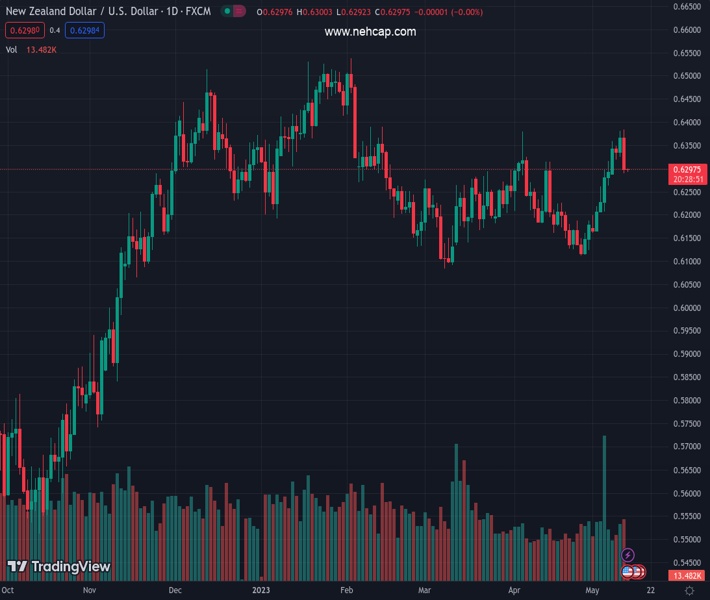
#NZDUSD @ 0.62967 holds lower ground near weekly bottom after falling the most in a month. (Pivot Orderbook analysis)
…
This is a premium post.
[s2If !current_user_can(access_s2member_level4)]Please register for FREE REGISTER to read full post below containing analysis. In case of any error or you think you are not able to read the full post below, please email us at support#nehcap.com [lwa][/s2If] [s2If current_user_can(access_s2member_level1)]
- NZD/USD holds lower ground near weekly bottom after falling the most in a month.
- Risk-off mood joins downbeat Business NZ PMI to weigh on Kiwi pair.
- US Michigan CSI, Consumer Inflation Expectations eyed for clear directions.
- Headlines surrounding US debt ceiling, banking are also important for better guide.
The pair currently trades last at 0.62967.
The previous day high was 0.6385 while the previous day low was 0.6289. The daily 38.2% Fib levels comes at 0.6326, expected to provide resistance. Similarly, the daily 61.8% fib level is at 0.6348, expected to provide resistance.
NZD/USD takes offers to refresh the intraday low near 0.6290, poking the weekly bottom marked the previous day during early Friday. In doing so, the Kiwi pair justifies the recently released downbeat data from New Zealand (NZ), as well as the sour sentiment. It’s worth observing that the commodity-linked pair dropped the most in a month the previous day amid broad US Dollar strength.
That said, Business NZ PMI for April dropped to 49.1 versus 50.7 expected and 48.1 prior whereas Visitor Arrivals eased to 805% in March versus prior growth of 4,998%.
On the other hand, the US Producer Price Index (PPI) improved to 0.2% MoM for April versus 0.3% expected and -0.4% prior. More importantly, PPI ex Food & Energy, known as Core PPI, rose on MoM but eased on YoY. Further, US Initial Jobless Claims rose by 264,000 to push the level to the highest level since October 2021, which in turn escalated the risk-off mood and favored the US Dollar.
Additionally weighing on the NZD/USD are the comments from Minneapolis Fed President Neel Kashkari as he mentioned on Thursday that inflation has eased but warned it is above the Fed’s 2% target while speaking at the Marquette CEO Town Hall in Michigan.
It should be noted that the recently escalating market fears surrounding the US debt ceiling expiry and banking fallouts, seem to allow the US Dollar to brace for the first weekly gain in three.
That said, the postponement of the debt ceiling talks between US President Joe Biden and House Speaker McCarthy and a slump in the shares of PacWest Bancorp appear the main negative developments in those matters. Additionally, warnings from US Treasury Secretary Janet Yellen and Beth Hammack, Chair of the Treasury Borrowing Advisory Committee and Co-Head of Goldman’s Global Financing Group, about US default, also threaten the market sentiment and weigh on the NZD/USD prices.
It’s worth observing, however, that the recent inaction of the S&P500 Futures and yields, following the downbeat Wall Street performance and two-day fall of the leading US Treasury bond yields, prod the Kiwi pair sellers ahead of some more clues about the US inflation.
That said, preliminary readings of the University of Michigan’s (UoM) Consumer Sentiment Index (CSI) for May, as well as the UoM 5-year Consumer Inflation Expectations for the said month, decorate Friday’s economic calendar and should be watched closely for clear directions. Also important are the updates on the US debt ceiling and banking fronts.
Also read: Michigan Consumer Sentiment Index Preview: Modest improvement not enough to boost the mood
NZD/USD bears need validation from a two-week-old ascending support line and the 100-DMA, respectively near 0.6290 and 0.6280, to keep the reins.
Technical Levels: Supports and Resistances
NZDUSD currently trading at 0.6294 at the time of writing. Pair opened at 0.6298 and is trading with a change of -0.06% % .
| Overview | Overview.1 | |
|---|---|---|
| 0 | Today last price | 0.6294 |
| 1 | Today Daily Change | -0.0004 |
| 2 | Today Daily Change % | -0.06% |
| 3 | Today daily open | 0.6298 |
The pair remains strongly bullish on the daily timeframe. It trades above its 20 SMA @ 0.6218, 50 SMA 0.622, 100 SMA @ 0.628 and 200 SMA @ 0.6161.
| Trends | Trends.1 | |
|---|---|---|
| 0 | Daily SMA20 | 0.6218 |
| 1 | Daily SMA50 | 0.6220 |
| 2 | Daily SMA100 | 0.6280 |
| 3 | Daily SMA200 | 0.6161 |
The previous day high was 0.6385 while the previous day low was 0.6289. The daily 38.2% Fib levels comes at 0.6326, expected to provide resistance. Similarly, the daily 61.8% fib level is at 0.6348, expected to provide resistance.
Note the levels of interest below:
- Pivot support is noted at 0.6263, 0.6228, 0.6167
- Pivot resistance is noted at 0.6359, 0.642, 0.6455
| Levels | Levels.1 |
|---|---|
| Previous Daily High | 0.6385 |
| Previous Daily Low | 0.6289 |
| Previous Weekly High | 0.6316 |
| Previous Weekly Low | 0.6160 |
| Previous Monthly High | 0.6389 |
| Previous Monthly Low | 0.6111 |
| Daily Fibonacci 38.2% | 0.6326 |
| Daily Fibonacci 61.8% | 0.6348 |
| Daily Pivot Point S1 | 0.6263 |
| Daily Pivot Point S2 | 0.6228 |
| Daily Pivot Point S3 | 0.6167 |
| Daily Pivot Point R1 | 0.6359 |
| Daily Pivot Point R2 | 0.6420 |
| Daily Pivot Point R3 | 0.6455 |
[/s2If]
Nehcap Expert Advisor
The NEHCAP MT4 EA is high quality professional trading system geared to generate returns without using GRID or martingales. Each trade has strict risk per trade parameter. The pairs under management include EURUSD, GBPUSD, AUDCAD, AUDNZD,GBPAUD, EURAUD, EURCAD, CHFJPY and many more.
The system is trading live: LIVE ACCOUNT TRACKING
You can run it free. Apply for a free trial and track our account. Buy the system or use profit share mechanism to generate returns on your MT4.
Join Our Telegram Group
")


