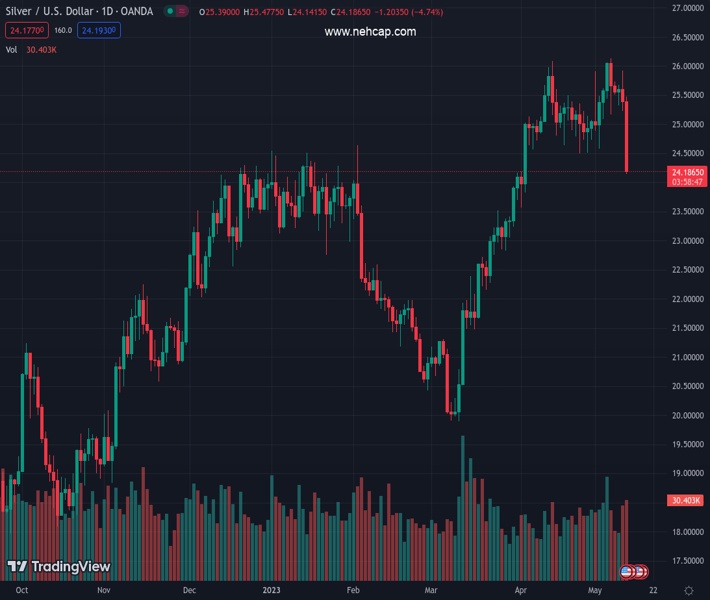
#XAGUSD @ 24.185 drops from around $25.40s to $24.10s as US inflation cools and the labor market eases. (Pivot Orderbook analysis)
…
This is a premium post.
[s2If !current_user_can(access_s2member_level4)]Please register for FREE REGISTER to read full post below containing analysis. In case of any error or you think you are not able to read the full post below, please email us at support#nehcap.com [lwa][/s2If] [s2If current_user_can(access_s2member_level1)]
- XAG/USD drops from around $25.40s to $24.10s as US inflation cools and the labor market eases.
- The RSI indicator and 3-day RoC portray a bearish outlook for Silver, with the 200-DMA on sight.
The pair currently trades last at 24.185.
The previous day high was 25.92 while the previous day low was 25.22. The daily 38.2% Fib levels comes at 25.49, expected to provide resistance. Similarly, the daily 61.8% fib level is at 25.66, expected to provide resistance.
Silver price plummets across the board, as data from the United States (US) showed that inflation is cooling down, while the labor market commences easing amidst US Federal Reserve (Fed) officials complaining about its tightness. US Treasury bond yields drop, but the US Dollar (USD) rises to new weekly highs, a headwind for XAG/USD prices. At the time of writing, the XAG/USD is trading at around $24.20, slides 4.50%.
The XAG/USD collapse dragged prices into testing the 50-day Exponential Moving Average (EMA), breaking on its way south two crucial support levels: firstly, the 20-day EMA gave way around $25.08, secondly the break of the two-week support trendline at around $24.63, which, accelerated the white metal downtrend, towards testing additional key support levels.
Silver is challenging a five-month-old previous resistance trendline, turned support at around $24.20, which, once broken, the XAG/USD could drop to the $24.00 figure, followed by the 100-day EMA at $23.46. A breach of the latter will expose the 200-day EMA at $22.74.
Conversely, if XAG/USD reclaims $24.63, that could pave the way toward $25.00 a troy ounce. That would form a bullish hammer, shifting Silver’s bias to the upside, and it might open the door to test the year-to-date (YTD) high of $26.13.
The Relative Strength Index (RSI) indicator turned bearish after crossing the 50-midline. The 3-day Rate of Change (RoC) portrays sellers in charge as the XAG/USD extends its slide throughout the day.
Technical Levels: Supports and Resistances
XAGUSD currently trading at 24.18 at the time of writing. Pair opened at 25.39 and is trading with a change of -4.77 % .
| Overview | Overview.1 | |
|---|---|---|
| 0 | Today last price | 24.18 |
| 1 | Today Daily Change | -1.21 |
| 2 | Today Daily Change % | -4.77 |
| 3 | Today daily open | 25.39 |
The pair is trading below its 20 Daily moving average @ 25.32, above its 50 Daily moving average @ 23.75 , above its 100 Daily moving average @ 23.39 and above its 200 Daily moving average @ 21.81
| Trends | Trends.1 | |
|---|---|---|
| 0 | Daily SMA20 | 25.32 |
| 1 | Daily SMA50 | 23.75 |
| 2 | Daily SMA100 | 23.39 |
| 3 | Daily SMA200 | 21.81 |
The previous day high was 25.92 while the previous day low was 25.22. The daily 38.2% Fib levels comes at 25.49, expected to provide resistance. Similarly, the daily 61.8% fib level is at 25.66, expected to provide resistance.
Note the levels of interest below:
- Pivot support is noted at 25.1, 24.81, 24.4
- Pivot resistance is noted at 25.8, 26.21, 26.5
| Levels | Levels.1 |
|---|---|
| Previous Daily High | 25.92 |
| Previous Daily Low | 25.22 |
| Previous Weekly High | 26.14 |
| Previous Weekly Low | 24.58 |
| Previous Monthly High | 26.09 |
| Previous Monthly Low | 23.57 |
| Daily Fibonacci 38.2% | 25.49 |
| Daily Fibonacci 61.8% | 25.66 |
| Daily Pivot Point S1 | 25.10 |
| Daily Pivot Point S2 | 24.81 |
| Daily Pivot Point S3 | 24.40 |
| Daily Pivot Point R1 | 25.80 |
| Daily Pivot Point R2 | 26.21 |
| Daily Pivot Point R3 | 26.50 |
[/s2If]
Nehcap Expert Advisor
The NEHCAP MT4 EA is high quality professional trading system geared to generate returns without using GRID or martingales. Each trade has strict risk per trade parameter. The pairs under management include EURUSD, GBPUSD, AUDCAD, AUDNZD,GBPAUD, EURAUD, EURCAD, CHFJPY and many more.
The system is trading live: LIVE ACCOUNT TRACKING
You can run it free. Apply for a free trial and track our account. Buy the system or use profit share mechanism to generate returns on your MT4.
Join Our Telegram Group
")


