WTI crude oil remains pressured after reversing from one-week high. (Pivot Orderbook analysis)
…
This is a premium post.
[s2If !current_user_can(access_s2member_level4)]Please register for FREE REGISTER to read full post below containing analysis. In case of any error or you think you are not able to read the full post below, please email us at support#nehcap.com [lwa][/s2If] [s2If current_user_can(access_s2member_level1)]
- WTI crude oil remains pressured after reversing from one-week high.
- Downbeat China inflation data joins mildly upbeat sentiment to prod Oil traders.
- Price-negative details of EIA crude oil stockpiles, cautious mood ahead of top-tier data/events challenge recent moves.
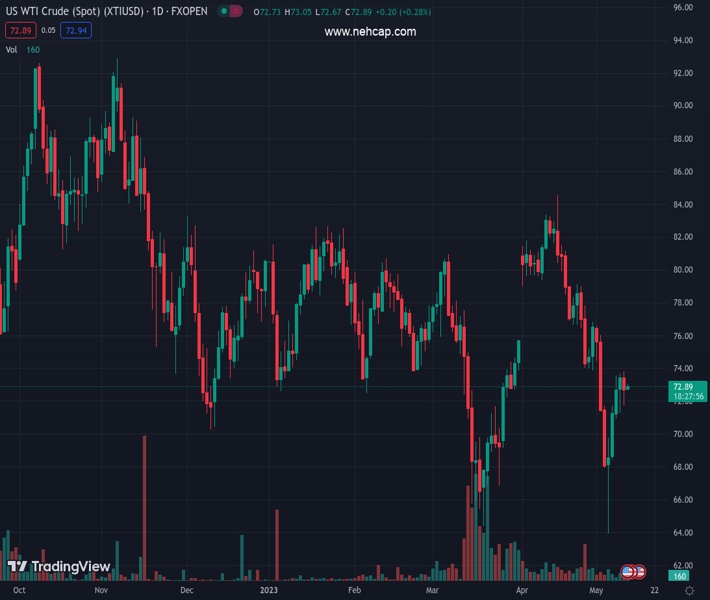
The pair currently trades last at 72.91.
The previous day high was 73.81 while the previous day low was 71.79. The daily 38.2% Fib levels comes at 72.56, expected to provide support. Similarly, the daily 61.8% fib level is at 73.04, expected to provide resistance.
WTI crude oil holds lower grounds near $72.80 amid early Thursday, following its pullback from a weekly top the previous day. In doing so, the black gold justifies downbeat inflation data from China and the US amid mixed sentiment and the price-negative Oil inventories.
Recently, China’s headline Consumer Price Index (CPI) eases to 0.1% YoY from 0.7% prior, versus 0.3% expected, while the Producer Price Index (PPI) slides to -3.6% YoY compared to -3.2% market consensus and -2.5% previous readings.
On Wednesday, US Consumer Price Index (CPI) eased to 4.9% YoY for April versus market expectations of reprinting 5.0% inflation mark, marking the first below 5.0% print in two years. The MoM figures, however, matched the upbeat 0.4% forecasts compared to 0.1% previous readings. Further, the CPI ex Food & Energy, known as the core CPI, matched 5.5% and 0.4% market consensus on a yearly and monthly basis respectively versus 5.6% and 0.4% priors in that order.
It’s worth noting that the weekly official Oil inventory data from the US Energy Information Administration (EIA) also exert downside pressure on the energy benchmark. That said, the EIA Crude Oil Stocks Change rose to 2.951M for the week ended on May 05 versus -0.917M market forecasts and -1.28M prior.
On a different page, the risk profile remains mildly positive and put a floor under the WTI prices as softer US inflation data weighs on the hawkish Fed bets. Also supporting the cautious optimism is the US policymakers’ preparations to avoid debt ceiling expiry despite failing in the initial attempt. Furthermore, expectations of the US-China policymakers’ meeting also underpin the slightly upbeat sentiment.
While portraying the mood, S&P 500 Futures print mild gains and the US Treasury bond yields extend the previous day’s downbeat performance, which in turn weighs on the US Dollar Index (DXY).
Looking forward, more clues of the US inflation, via the Producer Price Index (PPI) for April, expected to ease to 2.4% YoY, eyed for clear WTI directions.
WTI crude oil’s failure to provide a daily closing beyond the one-month-old resistance line, around $72.80 by the press time, keeps energy sellers hopeful of witnessing a pullback in price towards the 10-DMA support of near $72.30.
Technical Levels: Supports and Resistances
XTIUSD currently trading at 72.91 at the time of writing. Pair opened at 72.77 and is trading with a change of 0.19% % .
| Overview | Overview.1 | |
|---|---|---|
| 0 | Today last price | 72.91 |
| 1 | Today Daily Change | 0.14 |
| 2 | Today Daily Change % | 0.19% |
| 3 | Today daily open | 72.77 |
The pair remains strongly bearish on the daily time frame. It trades below the 20 SMA @ 75.81, 50 SMA 75.42, 100 SMA @ 76.73 and 200 SMA @ 80.67.
| Trends | Trends.1 | |
|---|---|---|
| 0 | Daily SMA20 | 75.81 |
| 1 | Daily SMA50 | 75.42 |
| 2 | Daily SMA100 | 76.73 |
| 3 | Daily SMA200 | 80.67 |
The previous day high was 73.81 while the previous day low was 71.79. The daily 38.2% Fib levels comes at 72.56, expected to provide support. Similarly, the daily 61.8% fib level is at 73.04, expected to provide resistance.
Note the levels of interest below:
- Pivot support is noted at 71.77, 70.77, 69.74
- Pivot resistance is noted at 73.79, 74.81, 75.81
| Levels | Levels.1 |
|---|---|
| Previous Daily High | 73.81 |
| Previous Daily Low | 71.79 |
| Previous Weekly High | 76.61 |
| Previous Weekly Low | 64.31 |
| Previous Monthly High | 83.40 |
| Previous Monthly Low | 73.88 |
| Daily Fibonacci 38.2% | 72.56 |
| Daily Fibonacci 61.8% | 73.04 |
| Daily Pivot Point S1 | 71.77 |
| Daily Pivot Point S2 | 70.77 |
| Daily Pivot Point S3 | 69.74 |
| Daily Pivot Point R1 | 73.79 |
| Daily Pivot Point R2 | 74.81 |
| Daily Pivot Point R3 | 75.81 |
[/s2If]
Nehcap Expert Advisor
The NEHCAP MT4 EA is high quality professional trading system geared to generate returns without using GRID or martingales. Each trade has strict risk per trade parameter. The pairs under management include EURUSD, GBPUSD, AUDCAD, AUDNZD,GBPAUD, EURAUD, EURCAD, CHFJPY and many more.
The system is trading live: LIVE ACCOUNT TRACKING
You can run it free. Apply for a free trial and track our account. Buy the system or use profit share mechanism to generate returns on your MT4.
Join Our Telegram Group
")


