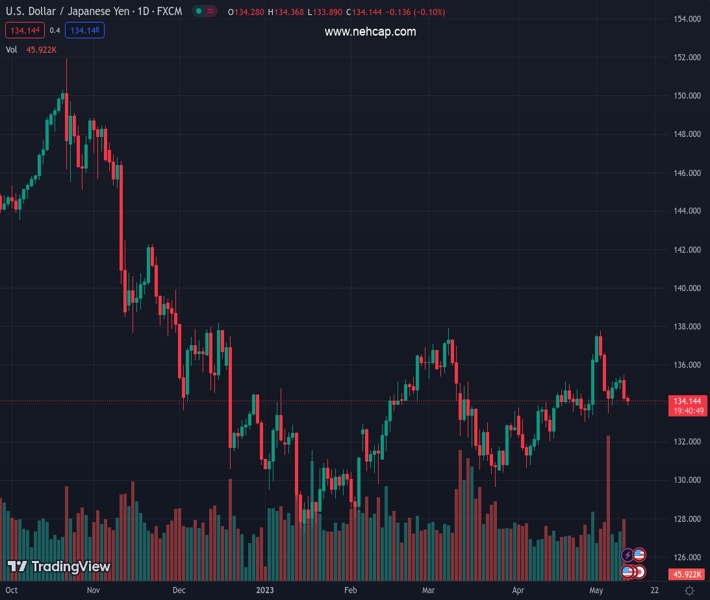
#USDJPY @ 134.073 takes offer to refresh weekly low, extends previous day’s pullback. (Pivot Orderbook analysis)
…
This is a premium post.
[s2If !current_user_can(access_s2member_level4)]Please register for FREE REGISTER to read full post below containing analysis. In case of any error or you think you are not able to read the full post below, please email us at support#nehcap.com [lwa][/s2If] [s2If current_user_can(access_s2member_level1)]
- USD/JPY takes offer to refresh weekly low, extends previous day’s pullback.
- BoJ April meeting Summary of Opinions defend easy-money policy.
- US inflation softens below 5.0% for the first time in two years, details appear mixed for Fed watchers.
- Yields remain pressured amid unimpressive developments on US debt ceiling talks, bank fallouts.
The pair currently trades last at 134.073.
The previous day high was 135.47 while the previous day low was 134.11. The daily 38.2% Fib levels comes at 134.63, expected to provide resistance. Similarly, the daily 61.8% fib level is at 134.95, expected to provide resistance.
USD/JPY fails to justify dovish signals from the Bank of Japan’s (BoJ) latest update as bears keep the reins while refreshing weekly low around 133.90 during early Thursday. In doing so, the Yen pair takes clues from the broad US Dollar weakness amid cautious optimism and downbeat Treasury bond yields.
Also read: BoJ April meeting Summary of Opinions: Must continue current easy policy given uncertainty over global outlook
US Dollar Index (DXY) drops for the second consecutive day, mildly offered near 101.35 by the press time, as the US inflation marked the first fall past 5.0% in two years. The US inflation details, however, weren’t that negative and seemed to have kept the Federal Reserve (Fed) away from the rate cut move until September 2023, per the Fed Fund Futures.
That said, US Consumer Price Index (CPI) eased to 4.9% YoY for April versus market expectations of reprinting 5.0% inflation mark, marking the first below 5.0% print in two years. The MoM figures, however, matched the upbeat 0.4% forecasts compared to 0.1% previous readings. Further, the CPI ex Food & Energy, known as the core CPI, matched 5.5% and 0.4% market consensus on a yearly and monthly basis respectively versus 5.6% and 0.4% priors in that order.
On the other hand, the US 10-year and two-year Treasury bond yields snapped a four-day winning streak the previous day, also marked the biggest daily loss in a week, as recession woes underpinned the US bond demand. That said, the benchmark US bond coupons remain pressured around 3.42% and 3.91% at the latest.
Elsewhere, the US policymakers failed to seal the debt-ceiling deal in their first attempt on Wednesday but let the ball rolling by allowing office members to discuss the details and try again on Friday, which in turn prod the market sentiment. On the same line is the absence of major negatives from the banking front, as well as upbeat earnings and mostly softer US data, which in turn pushed back the bank fears.
Against this backdrop, S&P 500 Futures print mild gains after Wall Street’s mixed close whereas Japan’s Nikkei 225 prints mild losses around 29,000 by the press time.
Looking forward, a light calendar in Japan may allow the USD/JPY pair bears to take a breather ahead of the US Producer Price Index (PPI) for April and other second-tier data relating to employment, as well as activities. Though, risk catalysts will be more observed amid the market’s cautious optimism.
A clear downside break of the 21-DMA and a one-month-old ascending trend line, respectively near 134.60 and 134.25, keeps USD/JPY bears hopeful.
Technical Levels: Supports and Resistances
USDJPY currently trading at 134.06 at the time of writing. Pair opened at 134.32 and is trading with a change of -0.19% % .
| Overview | Overview.1 | |
|---|---|---|
| 0 | Today last price | 134.06 |
| 1 | Today Daily Change | -0.26 |
| 2 | Today Daily Change % | -0.19% |
| 3 | Today daily open | 134.32 |
The pair is trading below its 20 Daily moving average @ 134.62, above its 50 Daily moving average @ 133.8 , above its 100 Daily moving average @ 132.87 and below its 200 Daily moving average @ 137.02
| Trends | Trends.1 | |
|---|---|---|
| 0 | Daily SMA20 | 134.62 |
| 1 | Daily SMA50 | 133.80 |
| 2 | Daily SMA100 | 132.87 |
| 3 | Daily SMA200 | 137.02 |
The previous day high was 135.47 while the previous day low was 134.11. The daily 38.2% Fib levels comes at 134.63, expected to provide resistance. Similarly, the daily 61.8% fib level is at 134.95, expected to provide resistance.
Note the levels of interest below:
- Pivot support is noted at 133.8, 133.28, 132.44
- Pivot resistance is noted at 135.16, 135.99, 136.51
| Levels | Levels.1 |
|---|---|
| Previous Daily High | 135.47 |
| Previous Daily Low | 134.11 |
| Previous Weekly High | 137.78 |
| Previous Weekly Low | 133.50 |
| Previous Monthly High | 136.56 |
| Previous Monthly Low | 130.63 |
| Daily Fibonacci 38.2% | 134.63 |
| Daily Fibonacci 61.8% | 134.95 |
| Daily Pivot Point S1 | 133.80 |
| Daily Pivot Point S2 | 133.28 |
| Daily Pivot Point S3 | 132.44 |
| Daily Pivot Point R1 | 135.16 |
| Daily Pivot Point R2 | 135.99 |
| Daily Pivot Point R3 | 136.51 |
[/s2If]
Nehcap Expert Advisor
The NEHCAP MT4 EA is high quality professional trading system geared to generate returns without using GRID or martingales. Each trade has strict risk per trade parameter. The pairs under management include EURUSD, GBPUSD, AUDCAD, AUDNZD,GBPAUD, EURAUD, EURCAD, CHFJPY and many more.
The system is trading live: LIVE ACCOUNT TRACKING
You can run it free. Apply for a free trial and track our account. Buy the system or use profit share mechanism to generate returns on your MT4.
Join Our Telegram Group
")


