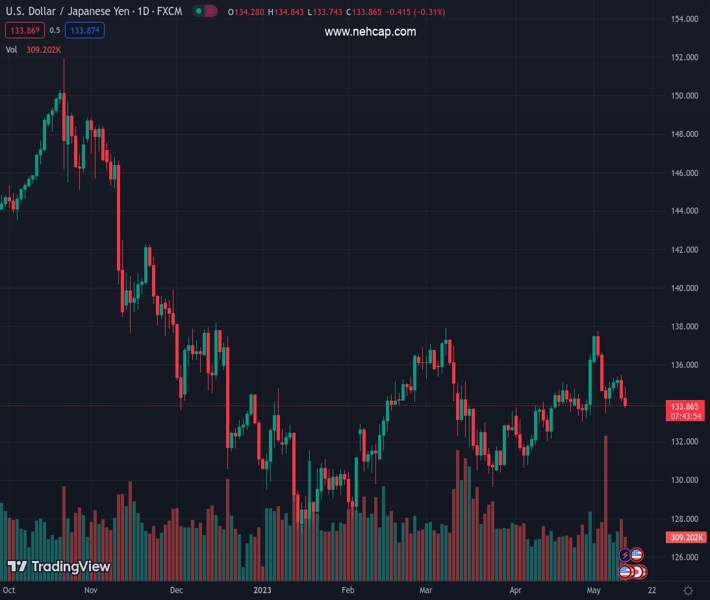
#USDJPY @ 133.794 drifts lower for the second successive day and drops to a fresh weekly low. (Pivot Orderbook analysis)
…
This is a premium post.
[s2If !current_user_can(access_s2member_level4)]Please register for FREE REGISTER to read full post below containing analysis. In case of any error or you think you are not able to read the full post below, please email us at support#nehcap.com [lwa][/s2If] [s2If current_user_can(access_s2member_level1)]
- USD/JPY drifts lower for the second successive day and drops to a fresh weekly low.
- A softer risk tone benefits the safe-haven JPY and exerts some downward pressure.
- A goodish pickup in the USD demand could lend support and limit further losses.
The pair currently trades last at 133.794.
The previous day high was 135.47 while the previous day low was 134.11. The daily 38.2% Fib levels comes at 134.63, expected to provide resistance. Similarly, the daily 61.8% fib level is at 134.95, expected to provide resistance.
The USD/JPY pair attracts fresh selling following an intraday uptick to the 134.85 region and turns back lower for the second straight day on Thursday. Spot prices continue losing ground through the early North American session and drop to a one-week low, around the 133.75 area in the last hour.
Against the backdrop of concerns over the US debt ceiling, mixed Chinese inflation figures released on Thursday fuel worries about the economic outlook for the second quarter and tempers investors’ appetite for riskier assets. This is evident from a fresh leg down in the equity markets, which boosts demand for the safe-haven Japanese Yen (JPY) and exerts downward pressure on the USD/JPY pair.
The global flight to safety, along with the growing acceptance that the Federal Reserve (Fed) is nearing the end of its year-long rate-hiking cycle, contributes to the ongoing fall in the US Treasury bond yields. This results in a further narrowing of the US-Japan rate differential and also benefits the JPY. That said, a goodish intraday pickup in the US Dollar (USD) demand could lend support to the USD/JPY pair.
The USD bulls, meanwhile, seem rather unaffected by the softer US Producer Price Index (PPI) and a larger-than-expected rise in the Weekly Initial Jobless Claims. This, in turn, might hold back traders from placing aggressive bearish bets around the USD/JPY pair. Nevertheless, spot prices remain well within the striking distance of the monthly swing low, around the mid-133.00s touched last Friday.
Technical Levels: Supports and Resistances
USDJPY currently trading at 133.84 at the time of writing. Pair opened at 134.32 and is trading with a change of -0.36 % .
| Overview | Overview.1 | |
|---|---|---|
| 0 | Today last price | 133.84 |
| 1 | Today Daily Change | -0.48 |
| 2 | Today Daily Change % | -0.36 |
| 3 | Today daily open | 134.32 |
The pair is trading below its 20 Daily moving average @ 134.62, above its 50 Daily moving average @ 133.8 , above its 100 Daily moving average @ 132.87 and below its 200 Daily moving average @ 137.02
| Trends | Trends.1 | |
|---|---|---|
| 0 | Daily SMA20 | 134.62 |
| 1 | Daily SMA50 | 133.80 |
| 2 | Daily SMA100 | 132.87 |
| 3 | Daily SMA200 | 137.02 |
The previous day high was 135.47 while the previous day low was 134.11. The daily 38.2% Fib levels comes at 134.63, expected to provide resistance. Similarly, the daily 61.8% fib level is at 134.95, expected to provide resistance.
Note the levels of interest below:
- Pivot support is noted at 133.8, 133.28, 132.44
- Pivot resistance is noted at 135.16, 135.99, 136.51
| Levels | Levels.1 |
|---|---|
| Previous Daily High | 135.47 |
| Previous Daily Low | 134.11 |
| Previous Weekly High | 137.78 |
| Previous Weekly Low | 133.50 |
| Previous Monthly High | 136.56 |
| Previous Monthly Low | 130.63 |
| Daily Fibonacci 38.2% | 134.63 |
| Daily Fibonacci 61.8% | 134.95 |
| Daily Pivot Point S1 | 133.80 |
| Daily Pivot Point S2 | 133.28 |
| Daily Pivot Point S3 | 132.44 |
| Daily Pivot Point R1 | 135.16 |
| Daily Pivot Point R2 | 135.99 |
| Daily Pivot Point R3 | 136.51 |
[/s2If]
Nehcap Expert Advisor
The NEHCAP MT4 EA is high quality professional trading system geared to generate returns without using GRID or martingales. Each trade has strict risk per trade parameter. The pairs under management include EURUSD, GBPUSD, AUDCAD, AUDNZD,GBPAUD, EURAUD, EURCAD, CHFJPY and many more.
The system is trading live: LIVE ACCOUNT TRACKING
You can run it free. Apply for a free trial and track our account. Buy the system or use profit share mechanism to generate returns on your MT4.
Join Our Telegram Group
")


