#USDCNH @ 6.94637 renews one-week high on softer China inflation data., @nehcap view: Further upside expected (Pivot Orderbook analysis)
…
This is a premium post.
[s2If !current_user_can(access_s2member_level4)]Please register for FREE REGISTER to read full post below containing analysis. In case of any error or you think you are not able to read the full post below, please email us at support#nehcap.com [lwa][/s2If] [s2If current_user_can(access_s2member_level1)]
- USD/CNH renews one-week high on softer China inflation data.
- China CPI, PPI both came in below expectations for April; US inflation numbers push back hawkish Fed expectations.
- Two-month-old symmetrical triangle restricts immediate moves of offshore China Yuan below 200-DMA.
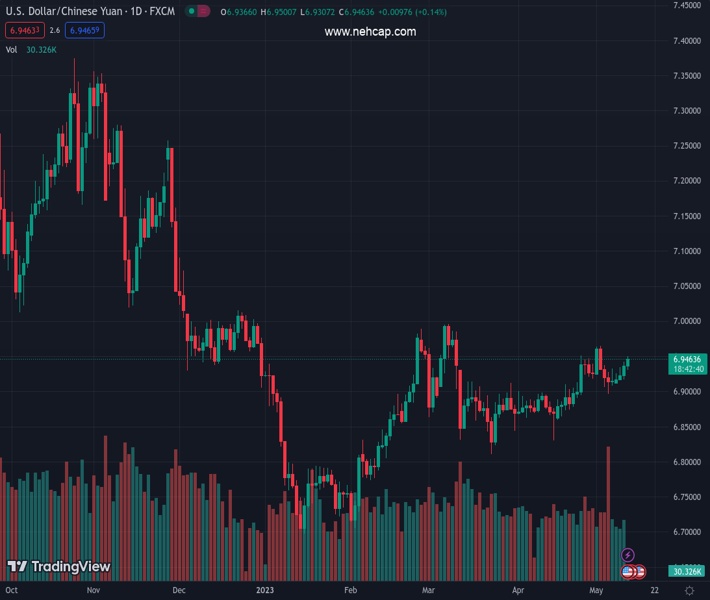
The pair currently trades last at 6.94637.
The previous day high was 6.9422 while the previous day low was 6.9168. The daily 38.2% Fib levels comes at 6.9324, expected to provide support. Similarly, the daily 61.8% fib level is at 6.9265, expected to provide support.
USD/CNH rises for the third consecutive day, refreshing a weekly high near 6.9450, amid downbeat inflation data from the US and China. That said, the offshore Chinese Yuan (CNH) pair awaits more clues to defy the hawkish bias surrounding the US Dollar on early Thursday.
That said, China’s headline Consumer Price Index (CPI) eases to 0.1% YoY from 0.7% prior, versus 0.3% expected, while the Producer Price Index (PPI) slides to -3.6% YoY compared to -3.2% market consensus and -2.5% previous readings.
On the other hand, US Consumer Price Index (CPI) eased to 4.9% YoY for April versus market expectations of reprinting 5.0% inflation mark, marking the first below 5.0% print in two years. The MoM figures, however, matched the upbeat 0.4% forecasts compared to 0.1% previous readings. Further, the CPI ex Food & Energy, known as the core CPI, matched 5.5% and 0.4% market consensus on a yearly and monthly basis respectively versus 5.6% and 0.4% priors in that order.
Technically, USD/CNH remains inside a two-month-old symmetrical triangle formation, currently between 6.9560 and 6.9190. Adding strength to the pair’s latest upside grind could be the firmer RSI (14) line, not overbought.
It’s worth noting that the quote’s run-up beyond the stated triangle’s top line, close to 6.9560 at the latest, needs to stabilize past the 200-DMA hurdle of 6.9620 to convince the USD/CNH bulls.
On the contrary, a downside break of the aforementioned triangle’s support line, close to 6.9190, isn’t an open invitation to the USD/CNH bears as there are multiple supports near 6.9100 and the 6.9000 levels that can restrict the pair’s further declines.
Trend: Further upside expected
Technical Levels: Supports and Resistances
USDCNH currently trading at 6.9428 at the time of writing. Pair opened at 6.9392 and is trading with a change of 0.05% % .
| Overview | Overview.1 | |
|---|---|---|
| 0 | Today last price | 6.9428 |
| 1 | Today Daily Change | 0.0036 |
| 2 | Today Daily Change % | 0.05% |
| 3 | Today daily open | 6.9392 |
The pair is trading above its 20 Daily moving average @ 6.9137, above its 50 Daily moving average @ 6.902 , above its 100 Daily moving average @ 6.873 and below its 200 Daily moving average @ 6.9603
| Trends | Trends.1 | |
|---|---|---|
| 0 | Daily SMA20 | 6.9137 |
| 1 | Daily SMA50 | 6.9020 |
| 2 | Daily SMA100 | 6.8730 |
| 3 | Daily SMA200 | 6.9603 |
The previous day high was 6.9422 while the previous day low was 6.9168. The daily 38.2% Fib levels comes at 6.9324, expected to provide support. Similarly, the daily 61.8% fib level is at 6.9265, expected to provide support.
Note the levels of interest below:
- Pivot support is noted at 6.9233, 6.9073, 6.8979
- Pivot resistance is noted at 6.9487, 6.9581, 6.9741
| Levels | Levels.1 |
|---|---|
| Previous Daily High | 6.9422 |
| Previous Daily Low | 6.9168 |
| Previous Weekly High | 6.9646 |
| Previous Weekly Low | 6.8962 |
| Previous Monthly High | 6.9508 |
| Previous Monthly Low | 6.8302 |
| Daily Fibonacci 38.2% | 6.9324 |
| Daily Fibonacci 61.8% | 6.9265 |
| Daily Pivot Point S1 | 6.9233 |
| Daily Pivot Point S2 | 6.9073 |
| Daily Pivot Point S3 | 6.8979 |
| Daily Pivot Point R1 | 6.9487 |
| Daily Pivot Point R2 | 6.9581 |
| Daily Pivot Point R3 | 6.9741 |
[/s2If]
Nehcap Expert Advisor
The NEHCAP MT4 EA is high quality professional trading system geared to generate returns without using GRID or martingales. Each trade has strict risk per trade parameter. The pairs under management include EURUSD, GBPUSD, AUDCAD, AUDNZD,GBPAUD, EURAUD, EURCAD, CHFJPY and many more.
The system is trading live: LIVE ACCOUNT TRACKING
You can run it free. Apply for a free trial and track our account. Buy the system or use profit share mechanism to generate returns on your MT4.
Join Our Telegram Group
")


