#USDCAD @ 1.34092 regains positive traction on Thursday amid the emergence of some USD buying. (Pivot Orderbook analysis)
…
This is a premium post.
[s2If !current_user_can(access_s2member_level4)]Please register for FREE REGISTER to read full post below containing analysis. In case of any error or you think you are not able to read the full post below, please email us at support#nehcap.com [lwa][/s2If] [s2If current_user_can(access_s2member_level1)]
- USD/CAD regains positive traction on Thursday amid the emergence of some USD buying.
- Bets for an imminent pause in the Fed’s rate-hiking cycle could cap the upside for the buck.
- An uptick in Oil prices might further contribute to keeping a lid on further gains for the pair.
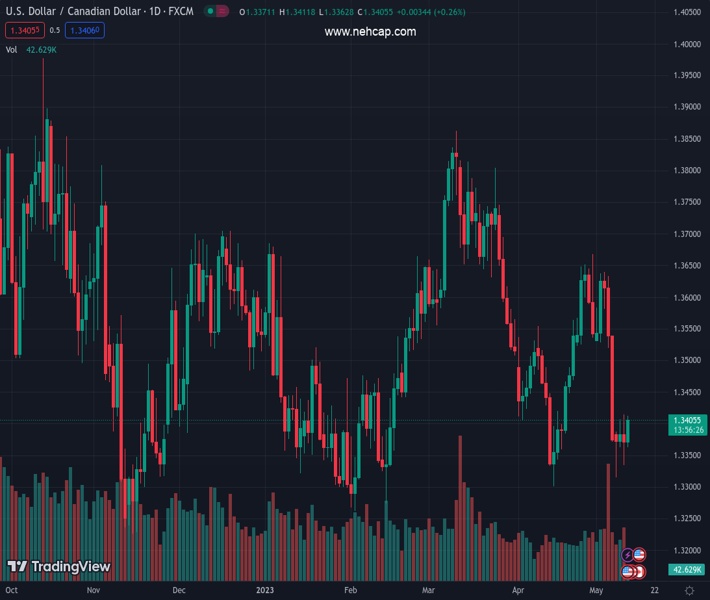
The pair currently trades last at 1.34092.
The previous day high was 1.3415 while the previous day low was 1.3335. The daily 38.2% Fib levels comes at 1.3365, expected to provide support. Similarly, the daily 61.8% fib level is at 1.3384, expected to provide support.
The USD/CAD pair builds on the overnight modest bounce from the 1.3335 area and gains some follow-through traction through the first half of trading on Thursday. The pair maintains its bid tone heading into the European session and climbs to a fresh daily high, just above the 1.3400 round-figure mark in the last hour.
The US Dollar (USD) is back in demand and climbs back closer to the top end of its recent trading range witnessed over the past week or so, which, in turn, is seen as a key factor lending some support to the USD/CAD pair. In the absence of a fresh fundamental trigger, the intraday USD uptick runs the risk of fizzling out rather quickly amid growing acceptance that the Federal Reserve (Fed) is nearing the end of its rate-hiking cycles.
The market expectations were reaffirmed by the release of the latest US CPI report on Wednesday, which further pointed to signs of an easing of inflationary pressures. This, along with concerns about the US debt ceiling, drags the US Treasury bond yields lower and might hold back the USD bulls from placing aggressive bets. Apart from this, a modest uptick in Oil prices could underpin the commodity-linked Loonie and cap the upside for the USD/CAD pair.
Even from a technical perspective, spot prices have been oscillating in a familiar one-week-old trading range, which points to indecision among traders over the near-term trajectory. This further makes it prudent to wait for strong follow-through buying before confirming that the USD/CAD pair has formed a near-term bottom and positioning for an extension of the recent recovery from the 1.3300 round-figure mark, or a two-month low touched on April 14.
Market participants now look to the US economic docket, featuring the release of the Producer Price Index (PPI) and the usual Weekly Initial Jobless Claims later during the early North American session. Apart from this, Fed Governor Christopher Waller’s scheduled speech and the US bond yields will drive the USD demand. This, along with Oil price dynamics, should provide some impetus to the USD/CAD pair and allow traders to grab short-term opportunities.
Technical Levels: Supports and Resistances
USDCAD currently trading at 1.3394 at the time of writing. Pair opened at 1.3372 and is trading with a change of 0.16 % .
| Overview | Overview.1 | |
|---|---|---|
| 0 | Today last price | 1.3394 |
| 1 | Today Daily Change | 0.0022 |
| 2 | Today Daily Change % | 0.1600 |
| 3 | Today daily open | 1.3372 |
The pair remains strongly bearish on the daily time frame. It trades below the 20 SMA @ 1.3487, 50 SMA 1.3572, 100 SMA @ 1.3516 and 200 SMA @ 1.3454.
| Trends | Trends.1 | |
|---|---|---|
| 0 | Daily SMA20 | 1.3487 |
| 1 | Daily SMA50 | 1.3572 |
| 2 | Daily SMA100 | 1.3516 |
| 3 | Daily SMA200 | 1.3454 |
The previous day high was 1.3415 while the previous day low was 1.3335. The daily 38.2% Fib levels comes at 1.3365, expected to provide support. Similarly, the daily 61.8% fib level is at 1.3384, expected to provide support.
Note the levels of interest below:
- Pivot support is noted at 1.3333, 1.3294, 1.3254
- Pivot resistance is noted at 1.3413, 1.3454, 1.3493
| Levels | Levels.1 |
|---|---|
| Previous Daily High | 1.3415 |
| Previous Daily Low | 1.3335 |
| Previous Weekly High | 1.3639 |
| Previous Weekly Low | 1.3371 |
| Previous Monthly High | 1.3668 |
| Previous Monthly Low | 1.3301 |
| Daily Fibonacci 38.2% | 1.3365 |
| Daily Fibonacci 61.8% | 1.3384 |
| Daily Pivot Point S1 | 1.3333 |
| Daily Pivot Point S2 | 1.3294 |
| Daily Pivot Point S3 | 1.3254 |
| Daily Pivot Point R1 | 1.3413 |
| Daily Pivot Point R2 | 1.3454 |
| Daily Pivot Point R3 | 1.3493 |
[/s2If]
Nehcap Expert Advisor
The NEHCAP MT4 EA is high quality professional trading system geared to generate returns without using GRID or martingales. Each trade has strict risk per trade parameter. The pairs under management include EURUSD, GBPUSD, AUDCAD, AUDNZD,GBPAUD, EURAUD, EURCAD, CHFJPY and many more.
The system is trading live: LIVE ACCOUNT TRACKING
You can run it free. Apply for a free trial and track our account. Buy the system or use profit share mechanism to generate returns on your MT4.
Join Our Telegram Group
")


