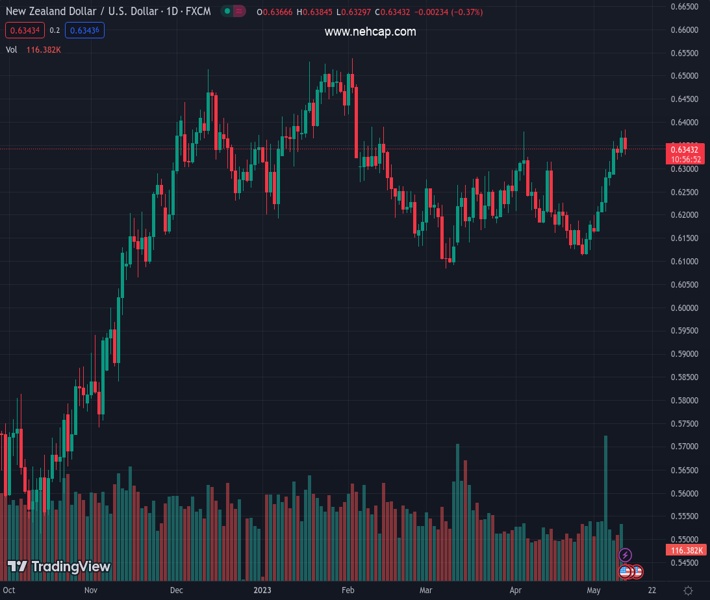
#NZDUSD @ 0.63430 pulls back from a nearly two-month top set on Thursday amid resurgent USD demand. (Pivot Orderbook analysis)
…
This is a premium post.
[s2If !current_user_can(access_s2member_level4)]Please register for FREE REGISTER to read full post below containing analysis. In case of any error or you think you are not able to read the full post below, please email us at support#nehcap.com [lwa][/s2If] [s2If current_user_can(access_s2member_level1)]
- NZD/USD pulls back from a nearly two-month top set on Thursday amid resurgent USD demand.
- Economic worries boost the safe-haven buck and exert pressure on the perceived riskier Kiwi.
- The fundamental backdrop warrants some caution before positioning for any meaningful slide.
The pair currently trades last at 0.63430.
The previous day high was 0.6381 while the previous day low was 0.6324. The daily 38.2% Fib levels comes at 0.6359, expected to provide resistance. Similarly, the daily 61.8% fib level is at 0.6346, expected to provide resistance.
The NZD/USD pair retreats from the 0.6385 region, or a nearly two-month high touched earlier this Thursday and maintains its offered tone through the first half of the European session. The pair is currently placed just a few pips above the daily low and trades around the 0.6345-0.6340 region, down
Mixed Chinese inflation data released on Thursday raises concerns about the broader economic outlook for the second quarter and turns out to be a key factor weighing on antipodean currencies, including the Kiwi. In fact, the National Bureau of Statistics (NBS) reported that the headline CPI in China rose by 0.1% rate in April, the lowest rate since February 2021, giving further evidence of tepid domestic demand. Moreover, China’s Producer Price Index (PPI) contracted for the seventh consecutive month and registered its fastest drop since May 2020. This, along with the resurgent US Dollar (USD), prompts aggressive long-unwinding around the NZD/USD pair and contributes to the intraday decline.
In fact, the USD Index (DXY), which tracks the Greenback against a basket of currencies, shot to over a one-week high in the wake of some short-covering amid the uncertainty over the Federal Reserve’s (Fed) policy outlook. The US CPI report released on Wednesday showed that consumer prices fell below the 5% YoY rate in April for the first time in two-year. This, in turn, paves the way for an imminent pause in the US central bank’s year-long rate-hiking cycle. In fact, the CME’s FedWatch tool indicates a greater chance that the Fed will hold interest rates at their current level in June. Investors, however, remain divided over the possibility of rate cuts later this year, which benefits the USD and weighs on the NZD/USD pair.
That said, expectations for further rate hikes by the Reserve Bank of New Zealand (RBNZ) might hold back traders from placing aggressive bearish bets around the NZD/USD pair and help limit deeper losses, at least for the time being. Market participants now look forward to the US economic docket, featuring the release of the Producer Price Index (PPI) and the usual Weekly Initial Jobless Claims data later during the early North American session. This, along with Fed Governor Christopher Waller’s scheduled speech and the US bond yields, will influence the USD price dynamics and allow traders to grab short-term opportunities.
Technical Levels: Supports and Resistances
NZDUSD currently trading at 0.6345 at the time of writing. Pair opened at 0.6367 and is trading with a change of -0.35 % .
| Overview | Overview.1 | |
|---|---|---|
| 0 | Today last price | 0.6345 |
| 1 | Today Daily Change | -0.0022 |
| 2 | Today Daily Change % | -0.3500 |
| 3 | Today daily open | 0.6367 |
The pair remains strongly bullish on the daily timeframe. It trades above its 20 SMA @ 0.6217, 50 SMA 0.6219, 100 SMA @ 0.6279 and 200 SMA @ 0.6161.
| Trends | Trends.1 | |
|---|---|---|
| 0 | Daily SMA20 | 0.6217 |
| 1 | Daily SMA50 | 0.6219 |
| 2 | Daily SMA100 | 0.6279 |
| 3 | Daily SMA200 | 0.6161 |
The previous day high was 0.6381 while the previous day low was 0.6324. The daily 38.2% Fib levels comes at 0.6359, expected to provide resistance. Similarly, the daily 61.8% fib level is at 0.6346, expected to provide resistance.
Note the levels of interest below:
- Pivot support is noted at 0.6333, 0.63, 0.6276
- Pivot resistance is noted at 0.6391, 0.6415, 0.6448
| Levels | Levels.1 |
|---|---|
| Previous Daily High | 0.6381 |
| Previous Daily Low | 0.6324 |
| Previous Weekly High | 0.6316 |
| Previous Weekly Low | 0.6160 |
| Previous Monthly High | 0.6389 |
| Previous Monthly Low | 0.6111 |
| Daily Fibonacci 38.2% | 0.6359 |
| Daily Fibonacci 61.8% | 0.6346 |
| Daily Pivot Point S1 | 0.6333 |
| Daily Pivot Point S2 | 0.6300 |
| Daily Pivot Point S3 | 0.6276 |
| Daily Pivot Point R1 | 0.6391 |
| Daily Pivot Point R2 | 0.6415 |
| Daily Pivot Point R3 | 0.6448 |
[/s2If]
Nehcap Expert Advisor
The NEHCAP MT4 EA is high quality professional trading system geared to generate returns without using GRID or martingales. Each trade has strict risk per trade parameter. The pairs under management include EURUSD, GBPUSD, AUDCAD, AUDNZD,GBPAUD, EURAUD, EURCAD, CHFJPY and many more.
The system is trading live: LIVE ACCOUNT TRACKING
You can run it free. Apply for a free trial and track our account. Buy the system or use profit share mechanism to generate returns on your MT4.
Join Our Telegram Group
")


