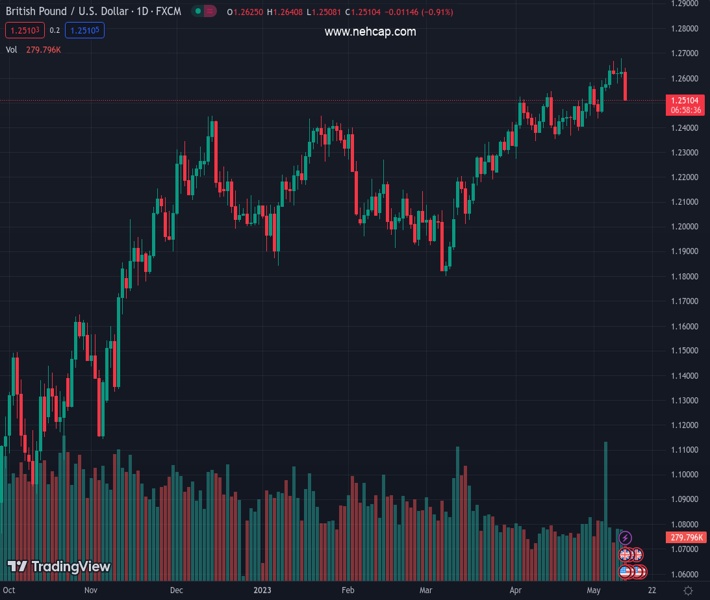
#GBPUSD @ 1.25098 meets with aggressive supply on Thursday and retreats further from a one-year peak. (Pivot Orderbook analysis)
…
This is a premium post.
[s2If !current_user_can(access_s2member_level4)]Please register for FREE REGISTER to read full post below containing analysis. In case of any error or you think you are not able to read the full post below, please email us at support#nehcap.com [lwa][/s2If] [s2If current_user_can(access_s2member_level1)]
- GBP/USD meets with aggressive supply on Thursday and retreats further from a one-year peak.
- Resurgent USD demand exerts heavy pressure as traders seem rather unimpressed by the BoE.
- The mixed technical setup suggests that spot prices could defend the ascending channel support.
The pair currently trades last at 1.25098.
The previous day high was 1.268 while the previous day low was 1.2603. The daily 38.2% Fib levels comes at 1.265, expected to provide resistance. Similarly, the daily 61.8% fib level is at 1.2632, expected to provide resistance.
The GBP/USD pair comes under intense selling pressure on Thursday and extends the overnight rejection slide from the 1.2680 region, a resistance marked by the top end of over a one-month-old ascending trend channel. The intraday downfall picks up pace after the Bank of England (BoE) announced its monetary policy decision and drags spot prices to over a one-week low, around the 1.2540 region during the early North American session.
The British Pound weakens across the board in the absence of any major surprises from the UK central bank, which, along with resurgent US Dollar (USD) demand, weigh heavily on the GBP/USD pair. The risk-off impulse – as depicted by a fresh leg down in the equity markets – turns out to be a key factor that benefits the safe-haven Greenback. The USD bulls, meanwhile, seem rather unaffected by the disappointing US macro data and a sharp intraday slide in the US Treasury bond yields. This, in turn, supports prospects for a further intraday downfall for the major.
From a technical perspective, a convincing break through the 100-hour Simple Moving Average (SMA), around the 1.2580-1.2575 area, which coincides with the weekly low touched on Tuesday, is seen as a key trigger for bearish traders. Moreover, oscillators on the 4-hour chart have been gaining negative traction and could drag the GBP/USD pair below the 1.2500 psychological mark. That said, technical indicators on the daily chart are still holding in the positive territory, which should allow spot prices to defend the ascending channel support, currently around the 1.2475 area.
On the flip side, any meaningful recovery attempt now seems to confront stiff resistance near the 1.2575-1.2580 area, or the 100-hour SMA. This is closely followed by the 1.2600 round-figure mark, which if cleared will suggest that the corrective slide has run its course and set the stage for the resumption of the recent upward trajectory witnessed over the past month or so. The GBP/USD pair might then surpass an intermediate hurdle near the 1.2630 region and aim to retest the YTD peak, around the 1.2680 area and challenge the trend-channel resistance, currently around the 1.2700 mark.
Technical Levels: Supports and Resistances
GBPUSD currently trading at 1.254 at the time of writing. Pair opened at 1.2626 and is trading with a change of -0.68 % .
| Overview | Overview.1 | |
|---|---|---|
| 0 | Today last price | 1.2540 |
| 1 | Today Daily Change | -0.0086 |
| 2 | Today Daily Change % | -0.6800 |
| 3 | Today daily open | 1.2626 |
The pair remains strongly bullish on the daily timeframe. It trades above its 20 SMA @ 1.2504, 50 SMA 1.2337, 100 SMA @ 1.224 and 200 SMA @ 1.1957.
| Trends | Trends.1 | |
|---|---|---|
| 0 | Daily SMA20 | 1.2504 |
| 1 | Daily SMA50 | 1.2337 |
| 2 | Daily SMA100 | 1.2240 |
| 3 | Daily SMA200 | 1.1957 |
The previous day high was 1.268 while the previous day low was 1.2603. The daily 38.2% Fib levels comes at 1.265, expected to provide resistance. Similarly, the daily 61.8% fib level is at 1.2632, expected to provide resistance.
Note the levels of interest below:
- Pivot support is noted at 1.2592, 1.2559, 1.2515
- Pivot resistance is noted at 1.2669, 1.2713, 1.2747
| Levels | Levels.1 |
|---|---|
| Previous Daily High | 1.2680 |
| Previous Daily Low | 1.2603 |
| Previous Weekly High | 1.2652 |
| Previous Weekly Low | 1.2436 |
| Previous Monthly High | 1.2584 |
| Previous Monthly Low | 1.2275 |
| Daily Fibonacci 38.2% | 1.2650 |
| Daily Fibonacci 61.8% | 1.2632 |
| Daily Pivot Point S1 | 1.2592 |
| Daily Pivot Point S2 | 1.2559 |
| Daily Pivot Point S3 | 1.2515 |
| Daily Pivot Point R1 | 1.2669 |
| Daily Pivot Point R2 | 1.2713 |
| Daily Pivot Point R3 | 1.2747 |
[/s2If]
Nehcap Expert Advisor
The NEHCAP MT4 EA is high quality professional trading system geared to generate returns without using GRID or martingales. Each trade has strict risk per trade parameter. The pairs under management include EURUSD, GBPUSD, AUDCAD, AUDNZD,GBPAUD, EURAUD, EURCAD, CHFJPY and many more.
The system is trading live: LIVE ACCOUNT TRACKING
You can run it free. Apply for a free trial and track our account. Buy the system or use profit share mechanism to generate returns on your MT4.
Join Our Telegram Group
")


