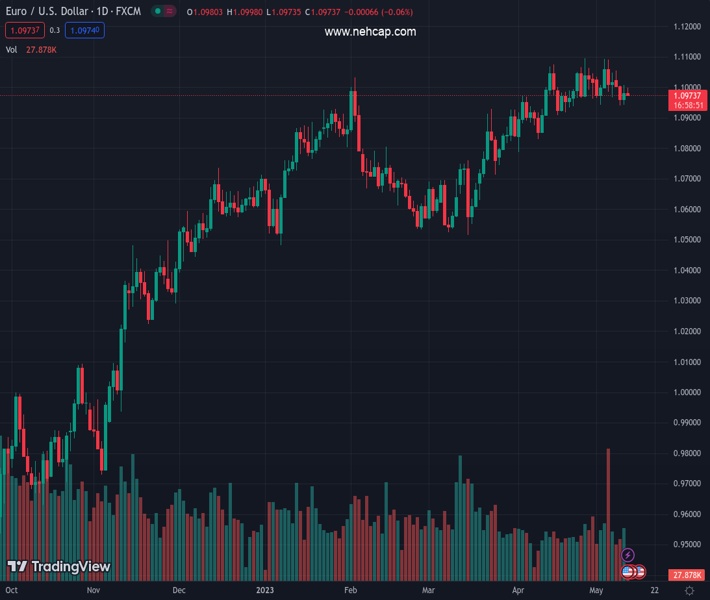
#EURUSD @ 1.09746 fades the previous day’s corrective bounce off weekly low. (Pivot Orderbook analysis)
…
This is a premium post.
[s2If !current_user_can(access_s2member_level4)]Please register for FREE REGISTER to read full post below containing analysis. In case of any error or you think you are not able to read the full post below, please email us at support#nehcap.com [lwa][/s2If] [s2If current_user_can(access_s2member_level1)]
- EUR/USD fades the previous day’s corrective bounce off weekly low.
- Recently mixed EU, German data raise doubts on hawkish ECB commentary.
- Softer US inflation fails to underpin Fed rate cut bias with mixed details.
- US PPI, second-tier data eyed for clear directions on Euro moves.
The pair currently trades last at 1.09746.
The previous day high was 1.1007 while the previous day low was 1.0942. The daily 38.2% Fib levels comes at 1.0982, expected to provide resistance. Similarly, the daily 61.8% fib level is at 1.0966, expected to provide support.
EUR/USD takes offers to refresh the intraday low around 1.0970 as it pares the previous day’s rebound from the weekly low heading into Thursday’s European session. In doing so, the Euro pair fails to justify the hawkish expectations from the European Central Bank (ECB), as well as downbeat US inflation clues, amid mixed sentiment.
Multiple ECB Officials including President Christine Lagarde, tried to defend the bloc’s central bank’s hawkish bias as some among the team consider the latest easing in the European and German statistics to suggest nearness to the policy pivot.
With this in mind, Bloomberg quotes people familiar with the debate while saying, “ECB officials are starting to accept that interest-rate increases might need to continue in September to bring inflation fully under control.”
Alternatively, the final reading of Germany’s headline inflation gauge, namely the Harmonized Index of Consumer Prices (HICP) for April, confirmed the initial estimations of 7.6% YoY versus 7.8% marked in March.
On the other hand, the US Consumer Price Index (CPI) eased to 4.9% YoY for April versus market expectations of reprinting the 5.0% mark, being the first below 5.0% print in two years. However, the details of the Core CPI, CPI ex Food and Energy, appear mixed and raise doubts on the chatters surrounding the Federal Reserve’s (Fed) policy pivot in 2023.
Elsewhere, softer US and China inflation data weighs on the hawkish central bank bets and allow markets to remain cautiously optimistic on early Thursday. Also supporting the sentiment are the US policymakers’ preparations to avoid debt ceiling expiry despite failing in the initial attempt. Furthermore, expectations of the US-China top-tier policymakers’ meeting also underpin the slightly upbeat sentiment.
Amid these plays, US stock futures print mild gains whereas US Treasury bond yields keep the previous day’s downbeat performance on the table, which in turn prods the US Dollar buyers.
Looking forward, a light calendar in the bloc highlights the risk catalysts as the notable directives for the EUR/USD pair traders to watch ahead of the US Producer Price Index (PPI) for April, expected to ease to 2.4% YoY.
EUR/USD retreats from a one-week-old descending resistance line, around the 1.1000 round figure, while dropping towards an upward-sloping support line from April 17, close to 1.0960 at the latest. That said, bearish MACD signals and a steady RSI (14) line keep Euro bears hopeful.
Technical Levels: Supports and Resistances
EURUSD currently trading at 1.0976 at the time of writing. Pair opened at 1.0982 and is trading with a change of -0.05% % .
| Overview | Overview.1 | |
|---|---|---|
| 0 | Today last price | 1.0976 |
| 1 | Today Daily Change | -0.0006 |
| 2 | Today Daily Change % | -0.05% |
| 3 | Today daily open | 1.0982 |
The pair is trading below its 20 Daily moving average @ 1.0999, above its 50 Daily moving average @ 1.0861 , above its 100 Daily moving average @ 1.0793 and above its 200 Daily moving average @ 1.0446
| Trends | Trends.1 | |
|---|---|---|
| 0 | Daily SMA20 | 1.0999 |
| 1 | Daily SMA50 | 1.0861 |
| 2 | Daily SMA100 | 1.0793 |
| 3 | Daily SMA200 | 1.0446 |
The previous day high was 1.1007 while the previous day low was 1.0942. The daily 38.2% Fib levels comes at 1.0982, expected to provide resistance. Similarly, the daily 61.8% fib level is at 1.0966, expected to provide support.
Note the levels of interest below:
- Pivot support is noted at 1.0947, 1.0912, 1.0882
- Pivot resistance is noted at 1.1012, 1.1042, 1.1078
| Levels | Levels.1 |
|---|---|
| Previous Daily High | 1.1007 |
| Previous Daily Low | 1.0942 |
| Previous Weekly High | 1.1092 |
| Previous Weekly Low | 1.0942 |
| Previous Monthly High | 1.1095 |
| Previous Monthly Low | 1.0788 |
| Daily Fibonacci 38.2% | 1.0982 |
| Daily Fibonacci 61.8% | 1.0966 |
| Daily Pivot Point S1 | 1.0947 |
| Daily Pivot Point S2 | 1.0912 |
| Daily Pivot Point S3 | 1.0882 |
| Daily Pivot Point R1 | 1.1012 |
| Daily Pivot Point R2 | 1.1042 |
| Daily Pivot Point R3 | 1.1078 |
[/s2If]
Nehcap Expert Advisor
The NEHCAP MT4 EA is high quality professional trading system geared to generate returns without using GRID or martingales. Each trade has strict risk per trade parameter. The pairs under management include EURUSD, GBPUSD, AUDCAD, AUDNZD,GBPAUD, EURAUD, EURCAD, CHFJPY and many more.
The system is trading live: LIVE ACCOUNT TRACKING
You can run it free. Apply for a free trial and track our account. Buy the system or use profit share mechanism to generate returns on your MT4.
Join Our Telegram Group
")


