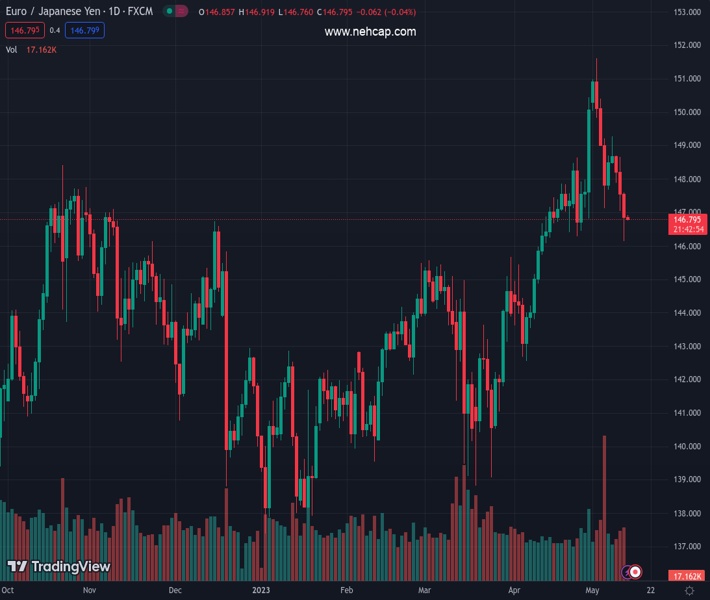
#EURJPY @ 146.850 breaks below the two-week support trendline, confirming a head-and-shoulders chart pattern., @nehcap view: Downward biased. (Pivot Orderbook analysis)
…
This is a premium post.
[s2If !current_user_can(access_s2member_level4)]Please register for FREE REGISTER to read full post below containing analysis. In case of any error or you think you are not able to read the full post below, please email us at support#nehcap.com [lwa][/s2If] [s2If current_user_can(access_s2member_level1)]
- EUR/JPY breaks below the two-week support trendline, confirming a head-and-shoulders chart pattern.
- The pair faces multiple support levels to target 143.20, including 50-day EMA at 146.00 and 100-day EMA at 144.59.
- Reclaiming 147.00 could open the door for gains and negate the bearish chart pattern, with the next resistance at 147.80-148.00.
The pair currently trades last at 146.850.
The previous day high was 148.67 while the previous day low was 147.04. The daily 38.2% Fib levels comes at 147.66, expected to provide resistance. Similarly, the daily 61.8% fib level is at 148.05, expected to provide resistance.
EUR/JPY confirms a break below a two-week support trendline, which also ensures the formation of a head-and-shoulders chart pattern that targets a drop of 450 pips toward 143.20, 50 pips shy of piercing the 200-day Exponential Moving Average (EMA) at 142.70. However, it should be said that it would need to hurdle support levels on its way south. As the Asian session begins, the EUR/JPY is trading at 146.85, down by 0.01%, after losing 0.46% on Thursday.
Given the backdrop, the GBP/JPY confirmed the formation of a head-and-shoulders chart pattern. Even though it is a bearish chart pattern, sellers must reclaim several demand areas on its way toward the 143.00 figure.
The EUR/JPY first support would be the 50-day Exponential Moving Average (EMA) at 146.00. A breach of the latter would sponsor a fall to the 100-day EMA at 144.59 before testing the 144.00 psychological level. Once cleared, the head-and-shoulders profit target of 143.20 should be reached.
The Relative Strength Index (RSI) indicator turned bearish, warranting that further downside is expected, while the 3-day Rate of Change (RoC), continues to slide below its neutral level.
Conversely, if EUR/JPY buyers reclaim 147.00, that could open the door for further gains. The next supply area to test would be the head-and-shoulders neckline at around 147.80-148.00, before reaching towards the last year’s high of 148.40, negating the bearish chart pattern.
Trend: Downward biased.
Technical Levels: Supports and Resistances
EURJPY currently trading at 146.85 at the time of writing. Pair opened at 147.56 and is trading with a change of -0.48 % .
| Overview | Overview.1 | |
|---|---|---|
| 0 | Today last price | 146.85 |
| 1 | Today Daily Change | -0.71 |
| 2 | Today Daily Change % | -0.48 |
| 3 | Today daily open | 147.56 |
The pair is trading below its 20 Daily moving average @ 148.06, above its 50 Daily moving average @ 145.31 , above its 100 Daily moving average @ 143.41 and above its 200 Daily moving average @ 142.94
| Trends | Trends.1 | |
|---|---|---|
| 0 | Daily SMA20 | 148.06 |
| 1 | Daily SMA50 | 145.31 |
| 2 | Daily SMA100 | 143.41 |
| 3 | Daily SMA200 | 142.94 |
The previous day high was 148.67 while the previous day low was 147.04. The daily 38.2% Fib levels comes at 147.66, expected to provide resistance. Similarly, the daily 61.8% fib level is at 148.05, expected to provide resistance.
Note the levels of interest below:
- Pivot support is noted at 146.84, 146.13, 145.22
- Pivot resistance is noted at 148.47, 149.38, 150.1
| Levels | Levels.1 |
|---|---|
| Previous Daily High | 148.67 |
| Previous Daily Low | 147.04 |
| Previous Weekly High | 151.62 |
| Previous Weekly Low | 147.13 |
| Previous Monthly High | 150.44 |
| Previous Monthly Low | 142.55 |
| Daily Fibonacci 38.2% | 147.66 |
| Daily Fibonacci 61.8% | 148.05 |
| Daily Pivot Point S1 | 146.84 |
| Daily Pivot Point S2 | 146.13 |
| Daily Pivot Point S3 | 145.22 |
| Daily Pivot Point R1 | 148.47 |
| Daily Pivot Point R2 | 149.38 |
| Daily Pivot Point R3 | 150.10 |
[/s2If]
Nehcap Expert Advisor
The NEHCAP MT4 EA is high quality professional trading system geared to generate returns without using GRID or martingales. Each trade has strict risk per trade parameter. The pairs under management include EURUSD, GBPUSD, AUDCAD, AUDNZD,GBPAUD, EURAUD, EURCAD, CHFJPY and many more.
The system is trading live: LIVE ACCOUNT TRACKING
You can run it free. Apply for a free trial and track our account. Buy the system or use profit share mechanism to generate returns on your MT4.
Join Our Telegram Group
")


