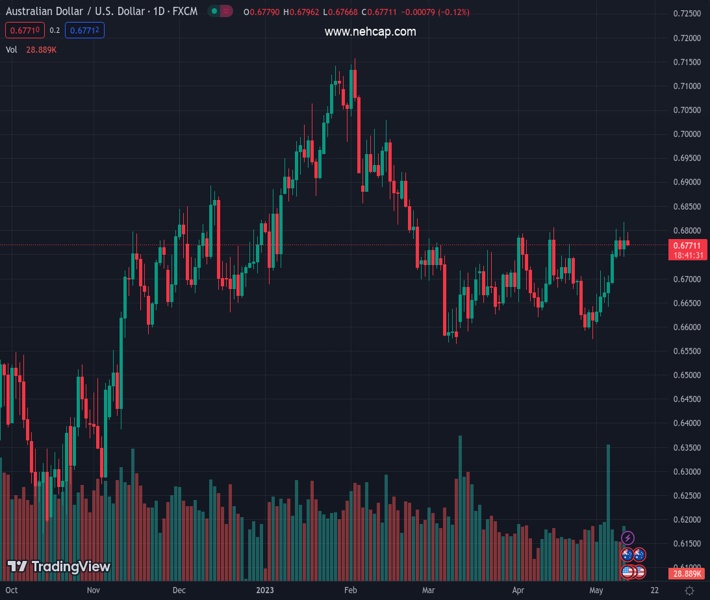
#AUDUSD @ 0.67722 eases from intraday top but stays on the way to reverse the previous day’s pullback from 11-week high. (Pivot Orderbook analysis)
…
This is a premium post.
[s2If !current_user_can(access_s2member_level4)]Please register for FREE REGISTER to read full post below containing analysis. In case of any error or you think you are not able to read the full post below, please email us at support#nehcap.com [lwa][/s2If] [s2If current_user_can(access_s2member_level1)]
- AUD/USD eases from intraday top but stays on the way to reverse the previous day’s pullback from 11-week high.
- Australia’s Consumer Inflation Expectations rise to 5.0% in May, versus 4.6% prior.
- China CPI improves on MoM eases on YoY, PPI drops in April.
- Softer US inflation data, recently release hawkish RBA documents favor Aussie bulls ahead of US PPI.
The pair currently trades last at 0.67722.
The previous day high was 0.6818 while the previous day low was 0.6744. The daily 38.2% Fib levels comes at 0.679, expected to provide resistance. Similarly, the daily 61.8% fib level is at 0.6773, expected to provide resistance.
AUD/USD takes a U-turn from the intraday high of near 0.6800 as bulls struggle to cheer upbeat inflation clues from Australia amid mixed China data published early Thursday. However, the softer US inflation and hawkish statements in the Reserve Bank of Australia (RBA) documents released under the Freedom of Information (FOI) request keep the Aussie pair buyers hopeful.
China’s headline Consumer Price Index (CPI) eases to 0.1% YoY from 0.7% prior, versus 0.3% expected, while the Producer Price Index (PPI) slides to -3.6% YoY compared to -3.2% market consensus and -2.5% previous readings. Earlier in the day, Australia’s Consumer Inflation Expectations for May rise to 5.0% versus 4.6% prior.
It’s worth noting that the RBA documents showed that the Aussie central bank paths with 4.8% cash rate show inflation at target in late-2024.
Elsewhere, market sentiment improves as softer US inflation data weighs on the hawkish Fed bets. Also supporting the cautious optimism is the US policymakers’ preparations to avoid debt ceiling expiry despite failing in the initial attempt. Furthermore, expectations of the US-China policymakers’ meeting and Australia’s readiness to have close ties with China also underpin the mildly positive sentiment and underpin the risk barometer pair’s run-up.
Amid these plays, S&P 500 Futures print mild gains and the US Treasury bond yields extend the previous day’s downbeat performance, which in turn weighs on the US Dollar Index (DXY) and puts a floor under the AUD/USD price.
Having witnessed the initial market reaction of the Aussie and Chinese inflation clues, AUD/USD pair traders should pay attention to the risk catalysts for intraday directions ahead of the US Producer Price Index (PPI) for April, expected to ease to 2.4% YoY.
AUD/USD bulls need a daily closing beyond the two-month-old ascending resistance line, around 0.6820 by the press time, to keep the reins.
Technical Levels: Supports and Resistances
AUDUSD currently trading at 0.6793 at the time of writing. Pair opened at 0.678 and is trading with a change of 0.19% % .
| Overview | Overview.1 | |
|---|---|---|
| 0 | Today last price | 0.6793 |
| 1 | Today Daily Change | 0.0013 |
| 2 | Today Daily Change % | 0.19% |
| 3 | Today daily open | 0.678 |
The pair remains strongly bullish on the daily timeframe. It trades above its 20 SMA @ 0.6698, 50 SMA 0.6686, 100 SMA @ 0.6791 and 200 SMA @ 0.6726.
| Trends | Trends.1 | |
|---|---|---|
| 0 | Daily SMA20 | 0.6698 |
| 1 | Daily SMA50 | 0.6686 |
| 2 | Daily SMA100 | 0.6791 |
| 3 | Daily SMA200 | 0.6726 |
The previous day high was 0.6818 while the previous day low was 0.6744. The daily 38.2% Fib levels comes at 0.679, expected to provide resistance. Similarly, the daily 61.8% fib level is at 0.6773, expected to provide resistance.
Note the levels of interest below:
- Pivot support is noted at 0.6743, 0.6707, 0.6669
- Pivot resistance is noted at 0.6817, 0.6855, 0.6891
| Levels | Levels.1 |
|---|---|
| Previous Daily High | 0.6818 |
| Previous Daily Low | 0.6744 |
| Previous Weekly High | 0.6757 |
| Previous Weekly Low | 0.6607 |
| Previous Monthly High | 0.6806 |
| Previous Monthly Low | 0.6574 |
| Daily Fibonacci 38.2% | 0.6790 |
| Daily Fibonacci 61.8% | 0.6773 |
| Daily Pivot Point S1 | 0.6743 |
| Daily Pivot Point S2 | 0.6707 |
| Daily Pivot Point S3 | 0.6669 |
| Daily Pivot Point R1 | 0.6817 |
| Daily Pivot Point R2 | 0.6855 |
| Daily Pivot Point R3 | 0.6891 |
[/s2If]
Nehcap Expert Advisor
The NEHCAP MT4 EA is high quality professional trading system geared to generate returns without using GRID or martingales. Each trade has strict risk per trade parameter. The pairs under management include EURUSD, GBPUSD, AUDCAD, AUDNZD,GBPAUD, EURAUD, EURCAD, CHFJPY and many more.
The system is trading live: LIVE ACCOUNT TRACKING
You can run it free. Apply for a free trial and track our account. Buy the system or use profit share mechanism to generate returns on your MT4.
Join Our Telegram Group
")


