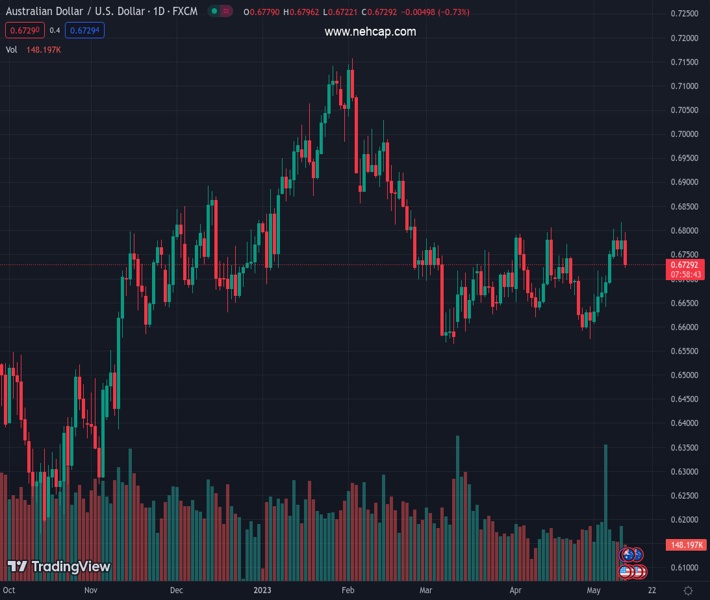
#AUDUSD @ 0.67332 once again faces rejection near the 100-day SMA amid resurgent USD demand. (Pivot Orderbook analysis)
…
This is a premium post.
[s2If !current_user_can(access_s2member_level4)]Please register for FREE REGISTER to read full post below containing analysis. In case of any error or you think you are not able to read the full post below, please email us at support#nehcap.com [lwa][/s2If] [s2If current_user_can(access_s2member_level1)]
- AUD/USD once again faces rejection near the 100-day SMA amid resurgent USD demand.
- The prospects for an imminent pause in the Fed’s rate-hiking cycle cap gains for the buck.
- The softer-than-expected US PPI fails to impress the USD bulls or provide a fresh impetus.
The pair currently trades last at 0.67332.
The previous day high was 0.6818 while the previous day low was 0.6744. The daily 38.2% Fib levels comes at 0.679, expected to provide resistance. Similarly, the daily 61.8% fib level is at 0.6773, expected to provide resistance.
The AUD/USD pair continues with its struggle to find acceptance above the 100-day Simple Moving Average (SMA) and attracts aggressive sellers in the vicinity of the 0.6800 mark on Thursday. The pair maintains its heavily offered through the early North American session and is currently placed around the 0.6745 region, just a few pips above the weekly low touched earlier today.
As investors look past Wednesday’s release of the US CPI report, a generally weaker risk tone pushes the safe-haven US Dollar (USD) to over a one-week high and turns out to be a key factor exerting downward pressure on the AUD/USD pair. Against the backdrop of concerns over the US debt ceiling, mixed Chinese inflation figures released on Thursday fuel worries about the economic outlook for the second quarter and tempers investors’ appetite for riskier assets. This, in turn, drives some haven flows towards the buck and undermines the risk-sensitive Aussie.
The upside for the USD, however, remains limited in the wake of growing acceptance that the Federal Reserve (Fed) is nearing the end of its year-long rate-hiking cycles. The bets were reaffirmed by the softer-than-expected release of the US Producer Price Index (PPI) on Thursday, which keeps the US Treasury bond yields depressed and caps the USD. Apart from this,
the Reserve Bank of Australia’s (RBA) hawkish outlook, indicating that some further tightening of monetary policy may be required to ensure that inflation returns to target, and limits losses for the AUD/USD pair.
Spot prices quickly bounce back closer to mid-0.6700s, though the recent repeated failures to build on the momentum beyond a technically significant moving average warrant some caution for bullish traders. The aforementioned supportive fundamental backdrop suggests that the path of least resistance for the AUD/USD pair is to the upside. Hence, any subsequent downfall might still be seen as a buying opportunity and is more likely to remain limited.
Technical Levels: Supports and Resistances
AUDUSD currently trading at 0.674 at the time of writing. Pair opened at 0.678 and is trading with a change of -0.59 % .
| Overview | Overview.1 | |
|---|---|---|
| 0 | Today last price | 0.674 |
| 1 | Today Daily Change | -0.004 |
| 2 | Today Daily Change % | -0.590 |
| 3 | Today daily open | 0.678 |
The pair is trading above its 20 Daily moving average @ 0.6698, above its 50 Daily moving average @ 0.6686 , below its 100 Daily moving average @ 0.6791 and above its 200 Daily moving average @ 0.6726
| Trends | Trends.1 | |
|---|---|---|
| 0 | Daily SMA20 | 0.6698 |
| 1 | Daily SMA50 | 0.6686 |
| 2 | Daily SMA100 | 0.6791 |
| 3 | Daily SMA200 | 0.6726 |
The previous day high was 0.6818 while the previous day low was 0.6744. The daily 38.2% Fib levels comes at 0.679, expected to provide resistance. Similarly, the daily 61.8% fib level is at 0.6773, expected to provide resistance.
Note the levels of interest below:
- Pivot support is noted at 0.6743, 0.6707, 0.6669
- Pivot resistance is noted at 0.6817, 0.6855, 0.6891
| Levels | Levels.1 |
|---|---|
| Previous Daily High | 0.6818 |
| Previous Daily Low | 0.6744 |
| Previous Weekly High | 0.6757 |
| Previous Weekly Low | 0.6607 |
| Previous Monthly High | 0.6806 |
| Previous Monthly Low | 0.6574 |
| Daily Fibonacci 38.2% | 0.6790 |
| Daily Fibonacci 61.8% | 0.6773 |
| Daily Pivot Point S1 | 0.6743 |
| Daily Pivot Point S2 | 0.6707 |
| Daily Pivot Point S3 | 0.6669 |
| Daily Pivot Point R1 | 0.6817 |
| Daily Pivot Point R2 | 0.6855 |
| Daily Pivot Point R3 | 0.6891 |
[/s2If]
Nehcap Expert Advisor
The NEHCAP MT4 EA is high quality professional trading system geared to generate returns without using GRID or martingales. Each trade has strict risk per trade parameter. The pairs under management include EURUSD, GBPUSD, AUDCAD, AUDNZD,GBPAUD, EURAUD, EURCAD, CHFJPY and many more.
The system is trading live: LIVE ACCOUNT TRACKING
You can run it free. Apply for a free trial and track our account. Buy the system or use profit share mechanism to generate returns on your MT4.
Join Our Telegram Group
")


