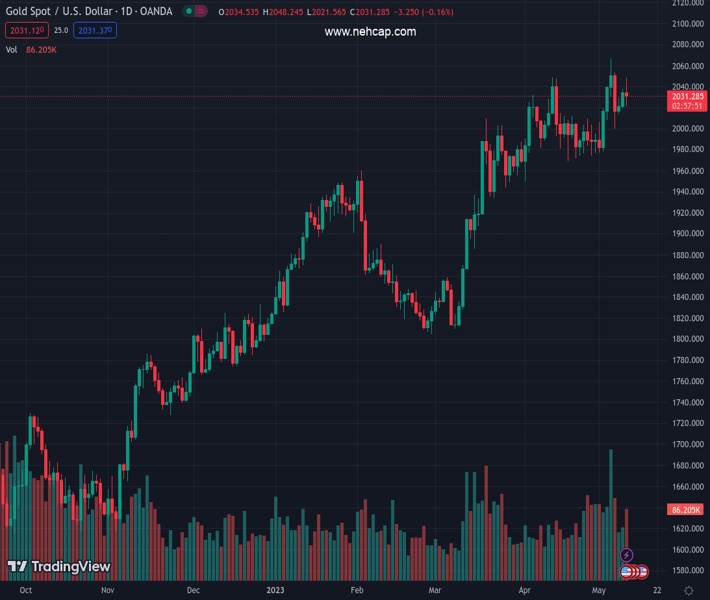
#XAUUSD @ 2,031.30 Gold slips 0.33% as US inflation data fuels uncertainty over Fed tightening cycle. (Pivot Orderbook analysis)
…
This is a premium post.
[s2If !current_user_can(access_s2member_level4)]Please register for FREE REGISTER to read full post below containing analysis. In case of any error or you think you are not able to read the full post below, please email us at support#nehcap.com [lwa][/s2If] [s2If current_user_can(access_s2member_level1)]
- Gold slips 0.33% as US inflation data fuels uncertainty over Fed tightening cycle.
- US Treasury bond yields drop while Biden and lawmakers continue debt ceiling discussions.
- China’s expanding gold reserves cushion XAU/USD’s fall; the market awaits Thursday’s PPI release.
The pair currently trades last at 2031.30.
The previous day high was 2037.65 while the previous day low was 2019.62. The daily 38.2% Fib levels comes at 2030.76, expected to provide support. Similarly, the daily 61.8% fib level is at 2026.51, expected to provide support.
Gold price slumps following the release of April’s inflation in the United States (US), which initially sent the XAU/USD to its daily high of $2048.15, though it retraced even though the US Dollar (USD) weakened on the news. Hence, the XAU/USD is trading at $2027.54, down 0.33%.
US Treasury bond yields dropped, with 2s and 10s, down eight and seven and a half bps, each at 3.935% and 3.446%, respectively. The greenback, which has an inverse correlation with Gold prices, slips 0.14%, down to 101.514.
The US Labor Department revealed the Consumer Price Index (CPI) for April continued to decelerate, as the CPI rose 0.4% MoM, aligned with estimates, while the year-over-year (YoY) came at 4.9%, below forecasts of 5%. Excluding volatile items like food and energy, the core CPI advanced 0.4% MoM, while annually based stood at around the 5.5% threshold.
Meanwhile, speculations that the US Federal Reserve (Fed) will pause its tightening cycle have increased, as shown by the CME FedWatch Tool, with odds at 95%.
On Tuesday, President Biden met with House Speaker Kevin McCarthy and other congressional leaders to discuss a possible increase or temporary stopping of the US debt ceiling. Even though there was no agreement, discussions would be held on Friday. On Monday, the US Treasury Secretary, Janet Yellen, has warned that if the debt ceiling is not raised, the government could run out of money by June 1.
As May comes to a close and if no extension is agreed upon, there will likely be an increase in overall market unease.
In other data, news that China is expanding its Gold reserves and may be abandoning the US Dollar cushioned XAU/USD’s fall. Sources cited by Kitco commented that China’s reserves increased by 8.09 tons in April.
The XAU/USD is still upward biased, though price action is forming a spinning top around the week’s highs. If XAU/USD achieves a daily close below the May 9 close of $2034.15, that could exacerbate a fall toward the day’s low at $2021.67 before testing the $2000 psychological level.
Of note, albeit at bullish territory, the Relative Strength Index (RSI) indicator aims toward a neutral level, suggesting that profit-taking took place as investors eye the release of Thursday’s Producer Price Index (PPI) release. The 3-day Rate of Change (RoC) shifted above the neutral level. Therefore, mixed signals by oscillators could refrain traders from opening fresh bets.
Technical Levels: Supports and Resistances
XAUUSD currently trading at 2030.08 at the time of writing. Pair opened at 2034.41 and is trading with a change of -0.21 % .
| Overview | Overview.1 | |
|---|---|---|
| 0 | Today last price | 2030.08 |
| 1 | Today Daily Change | -4.33 |
| 2 | Today Daily Change % | -0.21 |
| 3 | Today daily open | 2034.41 |
The pair remains strongly bullish on the daily timeframe. It trades above its 20 SMA @ 2007.82, 50 SMA 1961.31, 100 SMA @ 1913.63 and 200 SMA @ 1817.25.
| Trends | Trends.1 | |
|---|---|---|
| 0 | Daily SMA20 | 2007.82 |
| 1 | Daily SMA50 | 1961.31 |
| 2 | Daily SMA100 | 1913.63 |
| 3 | Daily SMA200 | 1817.25 |
The previous day high was 2037.65 while the previous day low was 2019.62. The daily 38.2% Fib levels comes at 2030.76, expected to provide support. Similarly, the daily 61.8% fib level is at 2026.51, expected to provide support.
Note the levels of interest below:
- Pivot support is noted at 2023.47, 2012.53, 2005.44
- Pivot resistance is noted at 2041.5, 2048.59, 2059.53
| Levels | Levels.1 |
|---|---|
| Previous Daily High | 2037.65 |
| Previous Daily Low | 2019.62 |
| Previous Weekly High | 2079.76 |
| Previous Weekly Low | 1977.12 |
| Previous Monthly High | 2048.75 |
| Previous Monthly Low | 1949.83 |
| Daily Fibonacci 38.2% | 2030.76 |
| Daily Fibonacci 61.8% | 2026.51 |
| Daily Pivot Point S1 | 2023.47 |
| Daily Pivot Point S2 | 2012.53 |
| Daily Pivot Point S3 | 2005.44 |
| Daily Pivot Point R1 | 2041.50 |
| Daily Pivot Point R2 | 2048.59 |
| Daily Pivot Point R3 | 2059.53 |
[/s2If]
Nehcap Expert Advisor
The NEHCAP MT4 EA is high quality professional trading system geared to generate returns without using GRID or martingales. Each trade has strict risk per trade parameter. The pairs under management include EURUSD, GBPUSD, AUDCAD, AUDNZD,GBPAUD, EURAUD, EURCAD, CHFJPY and many more.
The system is trading live: LIVE ACCOUNT TRACKING
You can run it free. Apply for a free trial and track our account. Buy the system or use profit share mechanism to generate returns on your MT4.
Join Our Telegram Group
")


