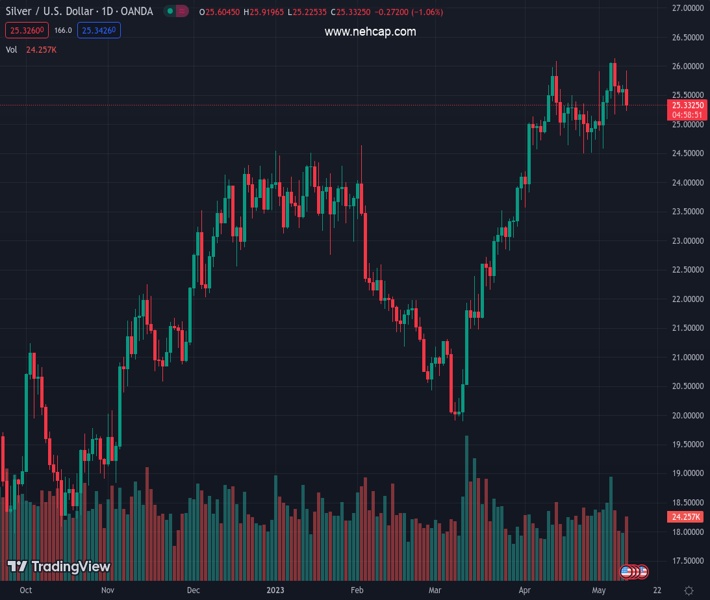
#XAGUSD @ 25.346 Silver price slides from a daily high of nearly $26.00, down nearly 1%. (Pivot Orderbook analysis)
…
This is a premium post.
[s2If !current_user_can(access_s2member_level4)]Please register for FREE REGISTER to read full post below containing analysis. In case of any error or you think you are not able to read the full post below, please email us at support#nehcap.com [lwa][/s2If] [s2If current_user_can(access_s2member_level1)]
- Silver price slides from a daily high of nearly $26.00, down nearly 1%.
- Disinflationary trends in the US economy persist, but core readings hold at 5.5% YoY.
- XAG/USD technical outlook suggests the potential for further decline, testing key support levels.
The pair currently trades last at 25.346.
The previous day high was 25.68 while the previous day low was 25.33. The daily 38.2% Fib levels comes at 25.54, expected to provide resistance. Similarly, the daily 61.8% fib level is at 25.46, expected to provide resistance.
Silver price slides after hitting a daily high of $25.91, following the release of US inflation figures continued to show that the economy is in a disinflationary process. Nevertheless, core readings are clinging to the 5.5% YoY barrier, which could warrant further tightening by the Fed. The XAG/USD is trading at around $25.30s, surprisingly down almost 1%, even though the US T-bond yields and the US Dollar (USD) remained down.
The XAG/USD daily chart suggests that sellers are gathering momentum, even though the uptrend remains intact. The Relative Strength Index (RSI) indicator flashes the previously mentioned, with the RSI edging towards its neutral level, while the 3-day Rate of Change (RoC) registers volatility in negative readings.
If XAG/USD continued to trend lower would test the 20-day Exponential Moving Average (EMA) at $25.17. In a decisive break, XAG/USD sellers will target the $25.00 figure, followed by the confluence of the 15-day upslope trendline and the February 2 high, turning support at around $24.60/70. A breach of the latter, XAG would slide toward the confluence of a five-month-old previous resistance trendline now support and the 50-day EMA at 24.29/40.
Conversely, the XAG/USD could resume its uptrend once buyers step in and reclaim the May 9 daily low of $25.33. In that outcome, the first resistance would be the May 9 high of $25.67, followed by the $26.00 figure.
Technical Levels: Supports and Resistances
XAGUSD currently trading at 25.35 at the time of writing. Pair opened at 25.61 and is trading with a change of -1.02 % .
| Overview | Overview.1 | |
|---|---|---|
| 0 | Today last price | 25.35 |
| 1 | Today Daily Change | -0.26 |
| 2 | Today Daily Change % | -1.02 |
| 3 | Today daily open | 25.61 |
The pair remains strongly bullish on the daily timeframe. It trades above its 20 SMA @ 25.33, 50 SMA 23.66, 100 SMA @ 23.37 and 200 SMA @ 21.78.
| Trends | Trends.1 | |
|---|---|---|
| 0 | Daily SMA20 | 25.33 |
| 1 | Daily SMA50 | 23.66 |
| 2 | Daily SMA100 | 23.37 |
| 3 | Daily SMA200 | 21.78 |
The previous day high was 25.68 while the previous day low was 25.33. The daily 38.2% Fib levels comes at 25.54, expected to provide resistance. Similarly, the daily 61.8% fib level is at 25.46, expected to provide resistance.
Note the levels of interest below:
- Pivot support is noted at 25.4, 25.19, 25.05
- Pivot resistance is noted at 25.75, 25.89, 26.1
| Levels | Levels.1 |
|---|---|
| Previous Daily High | 25.68 |
| Previous Daily Low | 25.33 |
| Previous Weekly High | 26.14 |
| Previous Weekly Low | 24.58 |
| Previous Monthly High | 26.09 |
| Previous Monthly Low | 23.57 |
| Daily Fibonacci 38.2% | 25.54 |
| Daily Fibonacci 61.8% | 25.46 |
| Daily Pivot Point S1 | 25.40 |
| Daily Pivot Point S2 | 25.19 |
| Daily Pivot Point S3 | 25.05 |
| Daily Pivot Point R1 | 25.75 |
| Daily Pivot Point R2 | 25.89 |
| Daily Pivot Point R3 | 26.10 |
[/s2If]
Nehcap Expert Advisor
The NEHCAP MT4 EA is high quality professional trading system geared to generate returns without using GRID or martingales. Each trade has strict risk per trade parameter. The pairs under management include EURUSD, GBPUSD, AUDCAD, AUDNZD,GBPAUD, EURAUD, EURCAD, CHFJPY and many more.
The system is trading live: LIVE ACCOUNT TRACKING
You can run it free. Apply for a free trial and track our account. Buy the system or use profit share mechanism to generate returns on your MT4.
Join Our Telegram Group
")


