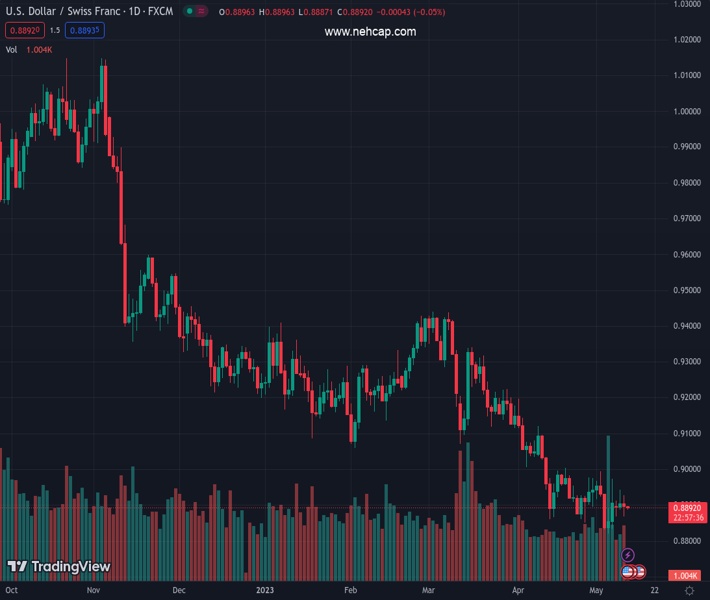
#USDCHF @ 0.88921 US inflation data disappoints, with CPI at 4.9% YoY, below 5% projections; slides towards 0.8890 (Pivot Orderbook analysis)
…
This is a premium post.
[s2If !current_user_can(access_s2member_level4)]Please register for FREE REGISTER to read full post below containing analysis. In case of any error or you think you are not able to read the full post below, please email us at support#nehcap.com [lwa][/s2If] [s2If current_user_can(access_s2member_level1)]
- US inflation data disappoints, with CPI at 4.9% YoY, below 5% projections; USD/CHF slides towards 0.8890
- SNB Governor Thomas Jordan’s hawkish comments emphasize the need for tighter monetary policy
- Federal Reserve expected to hold rates unchanged in June, with a 93.6% probability, according to CME FedWatch Tool
The pair currently trades last at 0.88921.
The previous day high was 0.8943 while the previous day low was 0.8888. The daily 38.2% Fib levels comes at 0.8922, expected to provide resistance. Similarly, the daily 61.8% fib level is at 0.8909, expected to provide resistance.
USD/CHF extends its bearish downtrend, though it appears to consolidate around the year-to-date (YTD) lows at around the 0.8800 handle after US data showed that prices are edging lower. In addition, hawkish rhetoric from the Swiss National Bank (SNB) Governor was cheered by USD/CHF bears. The USD/CHF is trading at around the 0.8890s area.
Inflation has been the main narrative of Wednesday’s session. The US Bureau of Labor Statistics (BLS) revealed the Consumer Price Index (CPI) in April expanded as expected by 0.4% MoM, while annually based, the data showed an improvement with prices edging below estimates—figures came at 4.9%, below projections of 5%.
The core CPI data, which the US Federal Reserve (Fed) monitors closely to assess inflation without the volatile items, jumped by 0.4% MoM. Year-over-year (YoY) core inflation rose by 5.5%, unchanged from the last reading and aligned with the market’s consensus.
Although inflation remains high, it hurt the USD/CHF prospects of higher prices, as the major dropped from the daily highs of 0.8927 back towards the 0.8890 area. On the upside, the USD/CHF rally was capped by the 20-day EMA at 0.8892 and the psychological 0.8900 figure.
Regarding news from Switzerland, SNB Governor Thomas Jordan commented that inflation remains above average for price stability and higher than the central bank wants. Jordan added that they don’t anticipate a wage-price spiral and emphasized that monetary policy “at the moment” is not restrictive enough. He said that the Swiss Franc (CHF) nominal appreciation was sparked by inflation abroad.
Given the backdrop, the Federal Reserve is expected to hold rates unchanged at their meeting in mid-June, as shown by the CME FedWatch Tool, with odds at 93.6%. A reflection of that is US Treasury bond yields, namely the 2-year note, the most sensitive to changes in monetary policy, dropping 11 bps to 3.910%.
The SNB’s hawkish rhetoric might refrain USD/CHF bulls from entering the market. The SNB is expected to continue tightening monetary conditions as inflation in Switzerland remains above the central bank’s target.
Technical Levels: Supports and Resistances
USDCHF currently trading at 0.8894 at the time of writing. Pair opened at 0.8905 and is trading with a change of -0.12 % .
| Overview | Overview.1 | |
|---|---|---|
| 0 | Today last price | 0.8894 |
| 1 | Today Daily Change | -0.0011 |
| 2 | Today Daily Change % | -0.1200 |
| 3 | Today daily open | 0.8905 |
The pair remains strongly bearish on the daily time frame. It trades below the 20 SMA @ 0.8922, 50 SMA 0.9096, 100 SMA @ 0.9176 and 200 SMA @ 0.9424.
| Trends | Trends.1 | |
|---|---|---|
| 0 | Daily SMA20 | 0.8922 |
| 1 | Daily SMA50 | 0.9096 |
| 2 | Daily SMA100 | 0.9176 |
| 3 | Daily SMA200 | 0.9424 |
The previous day high was 0.8943 while the previous day low was 0.8888. The daily 38.2% Fib levels comes at 0.8922, expected to provide resistance. Similarly, the daily 61.8% fib level is at 0.8909, expected to provide resistance.
Note the levels of interest below:
- Pivot support is noted at 0.8881, 0.8858, 0.8827
- Pivot resistance is noted at 0.8936, 0.8967, 0.8991
| Levels | Levels.1 |
|---|---|
| Previous Daily High | 0.8943 |
| Previous Daily Low | 0.8888 |
| Previous Weekly High | 0.8995 |
| Previous Weekly Low | 0.8820 |
| Previous Monthly High | 0.9198 |
| Previous Monthly Low | 0.8852 |
| Daily Fibonacci 38.2% | 0.8922 |
| Daily Fibonacci 61.8% | 0.8909 |
| Daily Pivot Point S1 | 0.8881 |
| Daily Pivot Point S2 | 0.8858 |
| Daily Pivot Point S3 | 0.8827 |
| Daily Pivot Point R1 | 0.8936 |
| Daily Pivot Point R2 | 0.8967 |
| Daily Pivot Point R3 | 0.8991 |
[/s2If]
Nehcap Expert Advisor
The NEHCAP MT4 EA is high quality professional trading system geared to generate returns without using GRID or martingales. Each trade has strict risk per trade parameter. The pairs under management include EURUSD, GBPUSD, AUDCAD, AUDNZD,GBPAUD, EURAUD, EURCAD, CHFJPY and many more.
The system is trading live: LIVE ACCOUNT TRACKING
You can run it free. Apply for a free trial and track our account. Buy the system or use profit share mechanism to generate returns on your MT4.
Join Our Telegram Group
")


