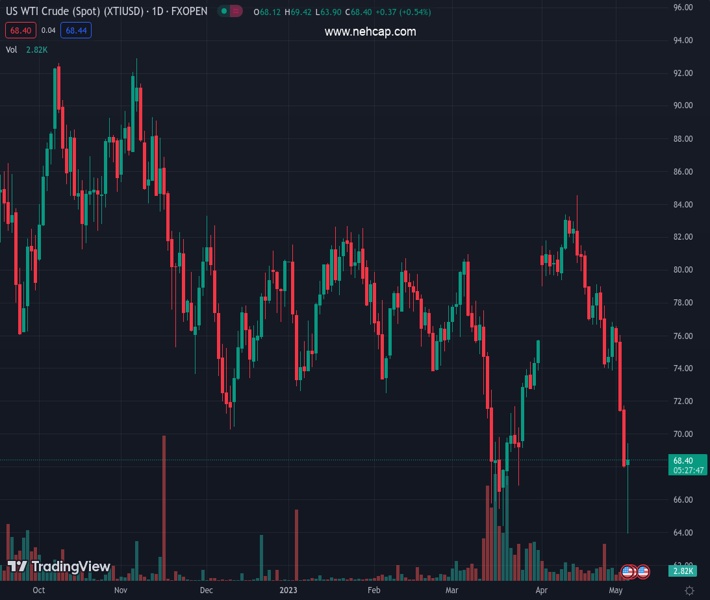
WTI grinds higher after hitting a new YTD low at around $63.00. (Pivot Orderbook analysis)
…
This is a premium post.
[s2If !current_user_can(access_s2member_level4)]Please register for FREE REGISTER to read full post below containing analysis. In case of any error or you think you are not able to read the full post below, please email us at support#nehcap.com [lwa][/s2If] [s2If current_user_can(access_s2member_level1)]
- WTI grinds higher after hitting a new YTD low at around $63.00.
- Global central bank tightening puts stress on oil prices with recession fears and lower demand potential.
- WTI Price Analysis: Analysis suggests relief for buyers with a rally above $70 but a potential fall to $60 is on the cards.
The pair currently trades last at 68.51.
The previous day high was 71.73 while the previous day low was 67.92. The daily 38.2% Fib levels comes at 69.38, expected to provide resistance. Similarly, the daily 61.8% fib level is at 70.27, expected to provide resistance.
Western Texas Intermediate (WTI), the US crude oil price, had shrugged off a $6.00 fall during the Asian session and is trading above its opening price. Two major central banks’ decisions weighed WTI’s price, though buyers moved in and lifted prices. At the time of writing, WTI is exchanging hands at $68.72 PB, gains almost 1%.
Sentiment is still sour, blamed on the US regional bank turmoil. Further losses in the segment keep the US financial markets under stress, though a lending hand from the US Federal Reserve (Fed) could calm investors.
On Wednesday, the Fed hiked rates by 25 bps and signaled it’s ready to hold rates at the 5.00%-5.25% range. Nevertheless, Powell and Co. emphasized that inflation is elevated, the jobs market remains tight, and the Fed is ready to act if needed.
WTi reacted negatively, finishing Wednesday’s session with more than 4.50% losses. During the Asian session, risk aversion weighed on oil prices as WTI plunged to its year-to-date (YTD) low of $63.73 before bouncing off those levels.
Another factor that weighed on WTI price was that manufacturing activity in China slid, according to Caixin Global. China’s Manufacturing PMI slumped into contractionary territory, falling to 49.5 from 50 in March, and 51.6 in February, signaling that the largest Asian economy is slowing down.
Of late, the European Central Bank (ECB) increased its interest rates to 3.75%, slowing its pace of 50 bps of tightening to 25. However, the ECB’s President Christine Lagarde reiterated that the central bank is not pausing, just slowing the rhythm of tightening.
Meanwhile, given that the Organization of Petroleum Export Countries and its allies (OPEC+) began to cut its output in May, it served as a cushion for the US crude oil benchmark to stay afloat above the $60.00 mark.
Regarding US stockpiles, inventories shrank as reported by official data released by the US Energy Information Administration (EIA) on Wednesday, falling just one million barrels last week.
WTI is in a downtrend, and despite recovering from its earlier losses, the $60.00 mark is eyed by sellers. Unless WTI buyers reclaim last year’s low of $70.10 PB, further downside is expected. WTI’s first support would be the March 24 low of $66.86, followed by its prior’s YTD low of $64.41. Conversely, a rally above $70.00 could offer buyers a respite, though downside risks remain as it remains below $75.00.
Technical Levels: Supports and Resistances
XTIUSD currently trading at 68.51 at the time of writing. Pair opened at 68.11 and is trading with a change of 0.59 % .
| Overview | Overview.1 | |
|---|---|---|
| 0 | Today last price | 68.51 |
| 1 | Today Daily Change | 0.40 |
| 2 | Today Daily Change % | 0.59 |
| 3 | Today daily open | 68.11 |
The pair remains strongly bearish on the daily time frame. It trades below the 20 SMA @ 78.14, 50 SMA 75.82, 100 SMA @ 76.94 and 200 SMA @ 81.26.
| Trends | Trends.1 | |
|---|---|---|
| 0 | Daily SMA20 | 78.14 |
| 1 | Daily SMA50 | 75.82 |
| 2 | Daily SMA100 | 76.94 |
| 3 | Daily SMA200 | 81.26 |
The previous day high was 71.73 while the previous day low was 67.92. The daily 38.2% Fib levels comes at 69.38, expected to provide resistance. Similarly, the daily 61.8% fib level is at 70.27, expected to provide resistance.
Note the levels of interest below:
- Pivot support is noted at 66.78, 65.45, 62.98
- Pivot resistance is noted at 70.58, 73.05, 74.38
| Levels | Levels.1 |
|---|---|
| Previous Daily High | 71.73 |
| Previous Daily Low | 67.92 |
| Previous Weekly High | 79.14 |
| Previous Weekly Low | 73.88 |
| Previous Monthly High | 83.40 |
| Previous Monthly Low | 73.88 |
| Daily Fibonacci 38.2% | 69.38 |
| Daily Fibonacci 61.8% | 70.27 |
| Daily Pivot Point S1 | 66.78 |
| Daily Pivot Point S2 | 65.45 |
| Daily Pivot Point S3 | 62.98 |
| Daily Pivot Point R1 | 70.58 |
| Daily Pivot Point R2 | 73.05 |
| Daily Pivot Point R3 | 74.38 |
[/s2If]
Nehcap Expert Advisor
The NEHCAP MT4 EA is high quality professional trading system geared to generate returns without using GRID or martingales. Each trade has strict risk per trade parameter. The pairs under management include EURUSD, GBPUSD, AUDCAD, AUDNZD,GBPAUD, EURAUD, EURCAD, CHFJPY and many more.
The system is trading live: LIVE ACCOUNT TRACKING
You can run it free. Apply for a free trial and track our account. Buy the system or use profit share mechanism to generate returns on your MT4.
Join Our Telegram Group
")


