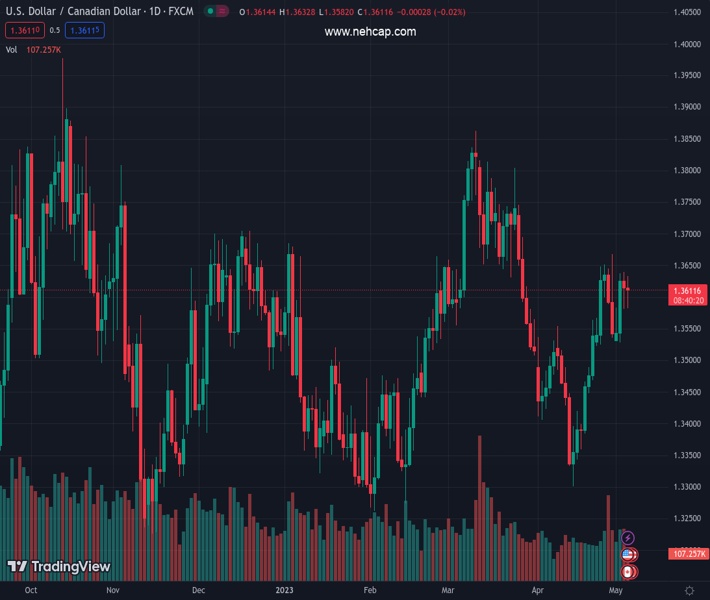
#USDCAD @ 1.36107 attracts some dip-buying on Thursday, albeit struggles to capitalize on the move. (Pivot Orderbook analysis)
…
This is a premium post.
[s2If !current_user_can(access_s2member_level4)]Please register for FREE REGISTER to read full post below containing analysis. In case of any error or you think you are not able to read the full post below, please email us at support#nehcap.com [lwa][/s2If] [s2If current_user_can(access_s2member_level1)]
- USD/CAD attracts some dip-buying on Thursday, albeit struggles to capitalize on the move.
- A modest USD bounce from over a one-week low is seen lending some support to the major.
- A solid intraday recovery in Oil prices underpins the Loonie and caps the upside for the pair.
The pair currently trades last at 1.36107.
The previous day high was 1.3639 while the previous day low was 1.3582. The daily 38.2% Fib levels comes at 1.3604, expected to provide support. Similarly, the daily 61.8% fib level is at 1.3617, expected to provide resistance.
The USD/CAD pair bounces off the 1.3580 area for the second successive day on Thursday, albeit struggles to capitalize on the move and remains depressed through the first half of the European session. The pair is currently placed around the 1.3600 mark and is influenced by a combination of diverging forces.
The US Dollar (USD) stages a modest recovery from over a one-week low and turns out to be a key factor lending some support to the USD/CAD pair. The prevalent cautious mood around the equity markets – amid looming recession risks – helps revive demand for the safe-haven Greenback. That said, an intraday turnaround in Crude Oil prices, following the early slump to the lowest level since December 2021, underpins the commodity-linked Loonie and acts as a headwind for the major.
Apart from this, the Federal Reserve’s (Fed) less hawkish outlook is holding back the USD bulls from placing aggressive bets and keeping a lid on the USD/CAD pair. It is worth recalling that the US central bank, as was widely expected, raised interest rates by 25 bps and opened the door for a possible pause in June at the end of a two-day monetary policy meeting on Wednesday. In the post-meeting presser, Powell signalled that the Fed was close to hitting the terminal rate of the current hiking cycle.
This, along with concerns over the US debt ceiling and renewed fears of a full-blown banking crisis, keeps the US Treasury bond yields depressed and should cap any meaningful upside for the Greenback, at least for the time being. Hence, it will be prudent to wait for strong follow-through buying before placing fresh bullish bets and positioning for an extension of this week’s goodish rebound from the 100-day Simple Moving Average (SMA) support near the 1.3530-1.3525 region.
Market participants now look to the release of the usual Weekly Initial Jobless Claims data from the US, due later during the early North American session. This, along with the US bond yields and the broader risk sentiment, will drive the USD demand and provide some impetus to the USD/CAD pair. Traders will further take cues from Oil price dynamics to grab short-term opportunities ahead of the Bank of Canada (BoC) Governor Tiff Macklem’s scheduled speech later this Thursday.
The focus, however, will remain glued to the closely-watched US monthly jobs data, popularly known as the NFP report on Friday. The data will influence the USD, which, along with the simultaneous release of Canadian monthly employment details, will help investors to determine the next leg of a directional move for the USD/CAD pair.
Technical Levels: Supports and Resistances
USDCAD currently trading at 1.3607 at the time of writing. Pair opened at 1.3615 and is trading with a change of -0.06 % .
| Overview | Overview.1 | |
|---|---|---|
| 0 | Today last price | 1.3607 |
| 1 | Today Daily Change | -0.0008 |
| 2 | Today Daily Change % | -0.0600 |
| 3 | Today daily open | 1.3615 |
The pair remains strongly bullish on the daily timeframe. It trades above its 20 SMA @ 1.3506, 50 SMA 1.359, 100 SMA @ 1.3528 and 200 SMA @ 1.344.
| Trends | Trends.1 | |
|---|---|---|
| 0 | Daily SMA20 | 1.3506 |
| 1 | Daily SMA50 | 1.3590 |
| 2 | Daily SMA100 | 1.3528 |
| 3 | Daily SMA200 | 1.3440 |
The previous day high was 1.3639 while the previous day low was 1.3582. The daily 38.2% Fib levels comes at 1.3604, expected to provide support. Similarly, the daily 61.8% fib level is at 1.3617, expected to provide resistance.
Note the levels of interest below:
- Pivot support is noted at 1.3585, 1.3555, 1.3528
- Pivot resistance is noted at 1.3642, 1.3669, 1.3699
| Levels | Levels.1 |
|---|---|
| Previous Daily High | 1.3639 |
| Previous Daily Low | 1.3582 |
| Previous Weekly High | 1.3668 |
| Previous Weekly Low | 1.3523 |
| Previous Monthly High | 1.3668 |
| Previous Monthly Low | 1.3301 |
| Daily Fibonacci 38.2% | 1.3604 |
| Daily Fibonacci 61.8% | 1.3617 |
| Daily Pivot Point S1 | 1.3585 |
| Daily Pivot Point S2 | 1.3555 |
| Daily Pivot Point S3 | 1.3528 |
| Daily Pivot Point R1 | 1.3642 |
| Daily Pivot Point R2 | 1.3669 |
| Daily Pivot Point R3 | 1.3699 |
[/s2If]
Nehcap Expert Advisor
The NEHCAP MT4 EA is high quality professional trading system geared to generate returns without using GRID or martingales. Each trade has strict risk per trade parameter. The pairs under management include EURUSD, GBPUSD, AUDCAD, AUDNZD,GBPAUD, EURAUD, EURCAD, CHFJPY and many more.
The system is trading live: LIVE ACCOUNT TRACKING
You can run it free. Apply for a free trial and track our account. Buy the system or use profit share mechanism to generate returns on your MT4.
Join Our Telegram Group
")


