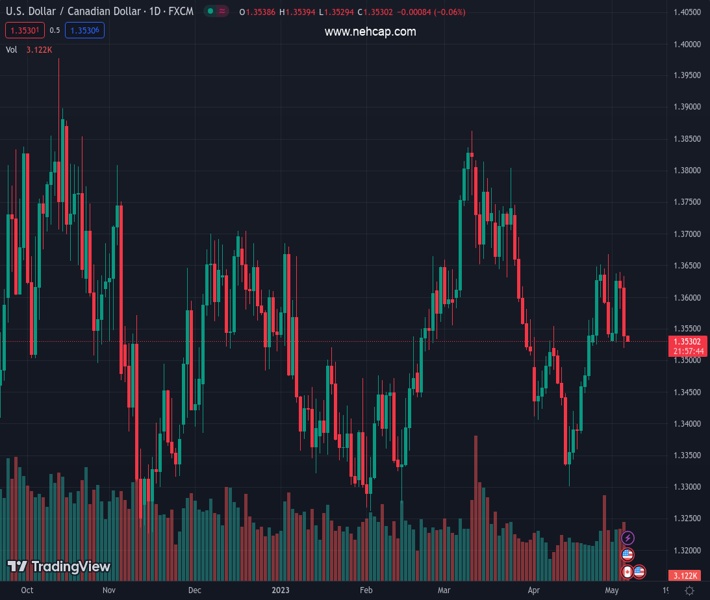
#USDCAD @ 1.35370 remains pressured around two-week low, has been drilling 100-DMA in the last fortnight., @nehcap view: Further downside expected (Pivot Orderbook analysis)
…
This is a premium post.
[s2If !current_user_can(access_s2member_level4)]Please register for FREE REGISTER to read full post below containing analysis. In case of any error or you think you are not able to read the full post below, please email us at support#nehcap.com [lwa][/s2If] [s2If current_user_can(access_s2member_level1)]
- USD/CAD remains pressured around two-week low, has been drilling 100-DMA in the last fortnight.
- Looming bear cross on MACD, steady RSI keep sellers hopeful of breaking the key support.
- Surprise recovery needs validation from two-month-old descending trend line.
- Mixed forecasts for US, Canada employment data for April keeps Loonie traders on their toes.
The pair currently trades last at 1.35370.
The previous day high was 1.3639 while the previous day low was 1.3582. The daily 38.2% Fib levels comes at 1.3604, expected to provide resistance. Similarly, the daily 61.8% fib level is at 1.3617, expected to provide resistance.
USD/CAD fades bounce off 100-DMA as it drops back to 1.3535 amid early Friday in Asia, after refreshing a two-week low the previous day. In doing so, the Loonie pair portrays the market’s anxiety ahead of the April month jobs report from the US and Canada while keeping the fortnight-long fight with an important moving average on.
Also read: USD/CAD plummets to the 1.3520s near prior week´s lows
Even if the 100-DMA continues to challenge the USD/CAD pair sellers in the last two weeks, the impending bear cross on the MACD and steady RSI suggests a clear break of the 1.3525 DMA support this time.
Following that, a quick drop toward the 61.8% Fibonacci retracement of the Loonie pair’s November 2022 to March 2023 upside, near 1.3465, can’t be ruled out.
However, the early April low of around 1.3400 and an upward-sloping support line from November 15, close to 1.3310 at the latest, can challenge the USD/CAD bears afterward.
On the contrary, the Loonie pair’s surprise bounce can’t convince the bulls unless crossing a descending resistance line from March 10, near 1.3640 by the press time.
Even if the quote rises past 1.3640, April’s peak of around 1.3670 may prod the USD/CAD bulls before giving them control.
Trend: Further downside expected
Technical Levels: Supports and Resistances
USDCAD currently trading at 1.3532 at the time of writing. Pair opened at 1.3615 and is trading with a change of -0.61% % .
| Overview | Overview.1 | |
|---|---|---|
| 0 | Today last price | 1.3532 |
| 1 | Today Daily Change | -0.0083 |
| 2 | Today Daily Change % | -0.61% |
| 3 | Today daily open | 1.3615 |
The pair is trading above its 20 Daily moving average @ 1.3506, below its 50 Daily moving average @ 1.359 , above its 100 Daily moving average @ 1.3528 and above its 200 Daily moving average @ 1.344
| Trends | Trends.1 | |
|---|---|---|
| 0 | Daily SMA20 | 1.3506 |
| 1 | Daily SMA50 | 1.3590 |
| 2 | Daily SMA100 | 1.3528 |
| 3 | Daily SMA200 | 1.3440 |
The previous day high was 1.3639 while the previous day low was 1.3582. The daily 38.2% Fib levels comes at 1.3604, expected to provide resistance. Similarly, the daily 61.8% fib level is at 1.3617, expected to provide resistance.
Note the levels of interest below:
- Pivot support is noted at 1.3585, 1.3555, 1.3528
- Pivot resistance is noted at 1.3642, 1.3669, 1.3699
| Levels | Levels.1 |
|---|---|
| Previous Daily High | 1.3639 |
| Previous Daily Low | 1.3582 |
| Previous Weekly High | 1.3668 |
| Previous Weekly Low | 1.3523 |
| Previous Monthly High | 1.3668 |
| Previous Monthly Low | 1.3301 |
| Daily Fibonacci 38.2% | 1.3604 |
| Daily Fibonacci 61.8% | 1.3617 |
| Daily Pivot Point S1 | 1.3585 |
| Daily Pivot Point S2 | 1.3555 |
| Daily Pivot Point S3 | 1.3528 |
| Daily Pivot Point R1 | 1.3642 |
| Daily Pivot Point R2 | 1.3669 |
| Daily Pivot Point R3 | 1.3699 |
[/s2If]
Nehcap Expert Advisor
The NEHCAP MT4 EA is high quality professional trading system geared to generate returns without using GRID or martingales. Each trade has strict risk per trade parameter. The pairs under management include EURUSD, GBPUSD, AUDCAD, AUDNZD,GBPAUD, EURAUD, EURCAD, CHFJPY and many more.
The system is trading live: LIVE ACCOUNT TRACKING
You can run it free. Apply for a free trial and track our account. Buy the system or use profit share mechanism to generate returns on your MT4.
Join Our Telegram Group
")


