#GBPJPY @ 168.688 The would resume upwards after a “quasi hammer” emerges nearby the 168.00 lows, with buyers eyeing 170.00. (Pivot Orderbook analysis)
…
This is a premium post.
[s2If !current_user_can(access_s2member_level4)]Please register for FREE REGISTER to read full post below containing analysis. In case of any error or you think you are not able to read the full post below, please email us at support#nehcap.com [lwa][/s2If] [s2If current_user_can(access_s2member_level1)]
- The GBP/JPY would resume upwards after a “quasi hammer” emerges nearby the 168.00 lows, with buyers eyeing 170.00.
- Bearish momentum builds if GBP/JPY fails to reclaim 169.00, as sellers would target a confluence of indicators at around 167.50.
The pair currently trades last at 168.688.
The previous day high was 170.39 while the previous day low was 169.15. The daily 38.2% Fib levels comes at 169.62, expected to provide resistance. Similarly, the daily 61.8% fib level is at 169.91, expected to provide resistance.
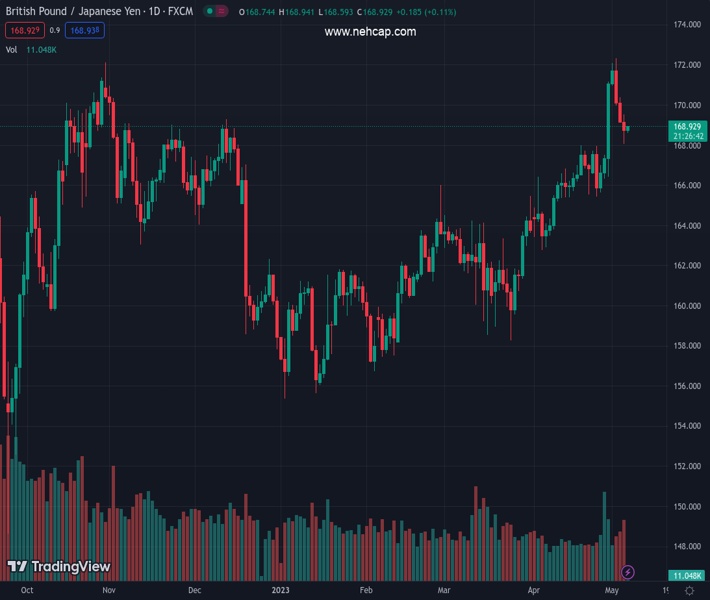
The GBP/JPY achieved three days of losses, though buyers are moving in as the Asian Pacific session begins. After hitting a weekly low of 168.05, the GBP/JPY bounced off, is trading at around 168.85, and gains 0.07% as it’s approaching the 169.00 figure.
The GBP/JPY pair remains upward biased, although it dropped from year-to-date (YTD) highs at 172.32 toward testing the April 19 cycle high at 167.97 resistance-turned-support. Additionally, a one-month-old upslope support trendline drawn from April lows that passes nearby that area and above the 20-day EMA sitting at 167.55 was difficult to crack for GBP/JPY sellers. In fact, Thursday’s price action formed a “quasi” hammer candlestick, suggesting that buyers are moving in, which could pave the way for further gains.
Further cementing the previously mentioned is the Relative Strength Index (RSI) indicator, which shifted direction to the upside after falling towards its neutral area in the previous three trading days.
Therefore, if GBP/JPY reclaims 169.00, a rally toward 170.00 is on the cards. A breach of the latter will expose the May 3 daily high at 170.37 before challenging the YTD high of 172.32. Conversely, a bearish continuation would happen if GBP/JPY drops below the April 19 resistance-turned-support at 167.97, followed by the 20-day EMA at 167.54, which intersects with a support trendline. Downside risks will emerge at 167.00.
Technical Levels: Supports and Resistances
GBPJPY currently trading at 168.94 at the time of writing. Pair opened at 169.24 and is trading with a change of -0.18 % .
| Overview | Overview.1 | |
|---|---|---|
| 0 | Today last price | 168.94 |
| 1 | Today Daily Change | -0.30 |
| 2 | Today Daily Change % | -0.18 |
| 3 | Today daily open | 169.24 |
The pair remains strongly bullish on the daily timeframe. It trades above its 20 SMA @ 167.13, 50 SMA 164.4, 100 SMA @ 162.34 and 200 SMA @ 163.44.
| Trends | Trends.1 | |
|---|---|---|
| 0 | Daily SMA20 | 167.13 |
| 1 | Daily SMA50 | 164.40 |
| 2 | Daily SMA100 | 162.34 |
| 3 | Daily SMA200 | 163.44 |
The previous day high was 170.39 while the previous day low was 169.15. The daily 38.2% Fib levels comes at 169.62, expected to provide resistance. Similarly, the daily 61.8% fib level is at 169.91, expected to provide resistance.
Note the levels of interest below:
- Pivot support is noted at 168.8, 168.35, 167.56
- Pivot resistance is noted at 170.04, 170.84, 171.28
| Levels | Levels.1 |
|---|---|
| Previous Daily High | 170.39 |
| Previous Daily Low | 169.15 |
| Previous Weekly High | 171.18 |
| Previous Weekly Low | 165.43 |
| Previous Monthly High | 171.18 |
| Previous Monthly Low | 162.78 |
| Daily Fibonacci 38.2% | 169.62 |
| Daily Fibonacci 61.8% | 169.91 |
| Daily Pivot Point S1 | 168.80 |
| Daily Pivot Point S2 | 168.35 |
| Daily Pivot Point S3 | 167.56 |
| Daily Pivot Point R1 | 170.04 |
| Daily Pivot Point R2 | 170.84 |
| Daily Pivot Point R3 | 171.28 |
[/s2If]
Nehcap Expert Advisor
The NEHCAP MT4 EA is high quality professional trading system geared to generate returns without using GRID or martingales. Each trade has strict risk per trade parameter. The pairs under management include EURUSD, GBPUSD, AUDCAD, AUDNZD,GBPAUD, EURAUD, EURCAD, CHFJPY and many more.
The system is trading live: LIVE ACCOUNT TRACKING
You can run it free. Apply for a free trial and track our account. Buy the system or use profit share mechanism to generate returns on your MT4.
Join Our Telegram Group
")


