#EURUSD @ 1.10101 remains depressed after snapping two-day winning streak. (Pivot Orderbook analysis)
…
This is a premium post.
[s2If !current_user_can(access_s2member_level4)]Please register for FREE REGISTER to read full post below containing analysis. In case of any error or you think you are not able to read the full post below, please email us at support#nehcap.com [lwa][/s2If] [s2If current_user_can(access_s2member_level1)]
- EUR/USD remains depressed after snapping two-day winning streak.
- ECB announces 0.25% rate hike, fastens pace of APP but couldn’t defend Euro.
- US Dollar licks Fed-induced wounds on mixed US data, banking crisis.
- US employment data for April will be the last key catalyst of the volatile week
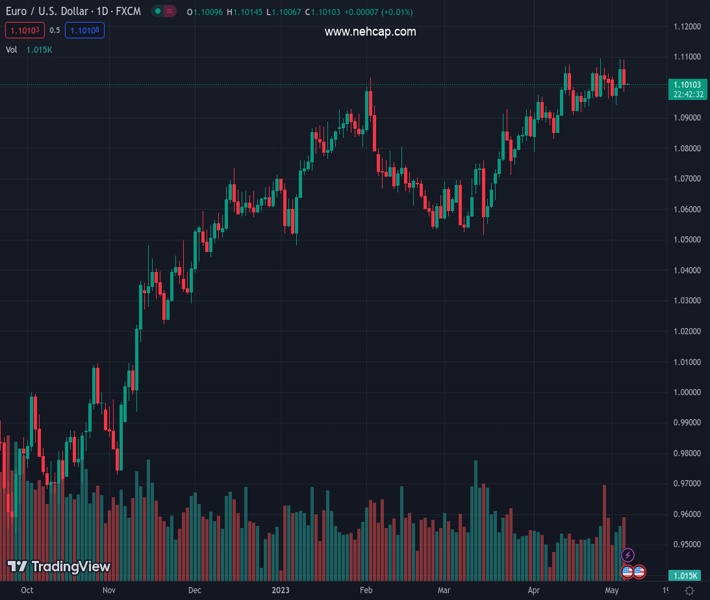
The pair currently trades last at 1.10101.
The previous day high was 1.1092 while the previous day low was 1.1. The daily 38.2% Fib levels comes at 1.1057, expected to provide resistance. Similarly, the daily 61.8% fib level is at 1.1035, expected to provide resistance.
EUR/USD holds lower grounds near 1.1010 after failing to cheer the comparatively hawkish European Central Bank (ECB) decision than the Federal Reserve. Apart from the ECB’s failure to keep the Euro bulls on the table, after a two-day uptrend, the banking fears also weigh on the major currency pair during the early hours of Friday in Asia.
On Thursday, European Central Bank (ECB) matched market forecasts by announcing a 25 basis points (bps) increase in its benchmark rates. The ECB also announced faster dialing back of its Asset Purchase Programme (APP) to around EUR25 billion per month from July, from the current pace of EUR15 billion per month. In return for a smaller rate hike, the ECB chose to remain hawkish and shut the door for a rate hike pause while saying, “Inflation outlook continues to be too high for too long.” Following the Interest Rate Decision, ECB President Christine Lagarde said, “We are not Fed-dependent in rate decisions, we can tighten if the Fed pauses.”
On the other hand, the US Goods and Services Trade Balance improved to $-64.2B from $-70.6B prior and $-63.3B market forecast. Further, Initial Jobless Claims edge higher to 242K for the week ended on April 28 versus 240K expected and 229K previous readings.
More importantly, preliminary readings of Nonfarm Productivity and Unit Labor Cost for the first quarter (Q1) of 2023 came in mixed. That said, Nonfarm Productivity dropped to -2.7% in Q1 from 1.6% prior and -1.8% market forecasts whereas the Unit Labor Cost jumped to 6.3% versus 5.5% expected and 3.3% prior.
It’s worth noting that the Fed’s hints for policy pivot called the US Dollar bears despite the rate hike of 25 basis points.
Elsewhere, bank fears are on their roll as Western Alliance and PacWest both recently signaled jitters in the US banking sector. On the same line, the fears of the US debt ceiling expiration also weigh on the market sentiment and exert downside pressure on the EUR/USD pair due to the US dollar’s haven demand.
Amid these plays, Wall Street closed negative and the yields were pressured too but the US Dollar bounced off its weekly low.
Moving on, EUR/USD traders should pay attention to the monthly US jobs report for April to pare the weekly losses in case of a positive surprise from the headline Nonfarm Payrolls (NFP) data.
Also read: US April Nonfarm Payrolls Preview: Analyzing Gold price’s reaction to NFP surprises
EUR/USD stays inside a three-week-old bullish channel, currently between 1.1115 and 1.0950, with the latest bearish signals from oscillators.
Technical Levels: Supports and Resistances
EURUSD currently trading at 1.1014 at the time of writing. Pair opened at 1.106 and is trading with a change of -0.42 % .
| Overview | Overview.1 | |
|---|---|---|
| 0 | Today last price | 1.1014 |
| 1 | Today Daily Change | -0.0046 |
| 2 | Today Daily Change % | -0.4200 |
| 3 | Today daily open | 1.1060 |
The pair remains strongly bullish on the daily timeframe. It trades above its 20 SMA @ 1.0979, 50 SMA 1.0821, 100 SMA @ 1.0774 and 200 SMA @ 1.0426.
| Trends | Trends.1 | |
|---|---|---|
| 0 | Daily SMA20 | 1.0979 |
| 1 | Daily SMA50 | 1.0821 |
| 2 | Daily SMA100 | 1.0774 |
| 3 | Daily SMA200 | 1.0426 |
The previous day high was 1.1092 while the previous day low was 1.1. The daily 38.2% Fib levels comes at 1.1057, expected to provide resistance. Similarly, the daily 61.8% fib level is at 1.1035, expected to provide resistance.
Note the levels of interest below:
- Pivot support is noted at 1.101, 1.096, 1.0919
- Pivot resistance is noted at 1.1101, 1.1142, 1.1192
| Levels | Levels.1 |
|---|---|
| Previous Daily High | 1.1092 |
| Previous Daily Low | 1.1000 |
| Previous Weekly High | 1.1095 |
| Previous Weekly Low | 1.0962 |
| Previous Monthly High | 1.1095 |
| Previous Monthly Low | 1.0788 |
| Daily Fibonacci 38.2% | 1.1057 |
| Daily Fibonacci 61.8% | 1.1035 |
| Daily Pivot Point S1 | 1.1010 |
| Daily Pivot Point S2 | 1.0960 |
| Daily Pivot Point S3 | 1.0919 |
| Daily Pivot Point R1 | 1.1101 |
| Daily Pivot Point R2 | 1.1142 |
| Daily Pivot Point R3 | 1.1192 |
[/s2If]
Nehcap Expert Advisor
The NEHCAP MT4 EA is high quality professional trading system geared to generate returns without using GRID or martingales. Each trade has strict risk per trade parameter. The pairs under management include EURUSD, GBPUSD, AUDCAD, AUDNZD,GBPAUD, EURAUD, EURCAD, CHFJPY and many more.
The system is trading live: LIVE ACCOUNT TRACKING
You can run it free. Apply for a free trial and track our account. Buy the system or use profit share mechanism to generate returns on your MT4.
Join Our Telegram Group
")


