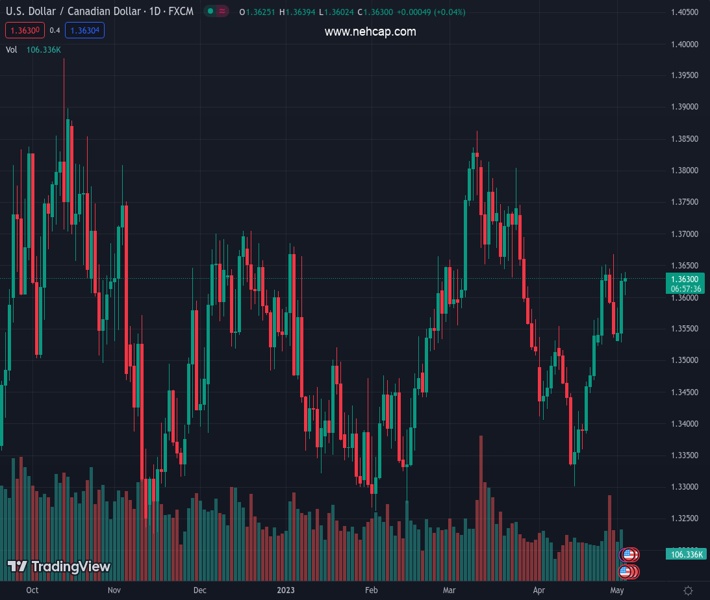
#USDCAD @ 1.36315 reverses an intraday dip and climbs to a fresh weekly high on Wednesday. (Pivot Orderbook analysis)
…
This is a premium post.
[s2If !current_user_can(access_s2member_level4)]Please register for FREE REGISTER to read full post below containing analysis. In case of any error or you think you are not able to read the full post below, please email us at support#nehcap.com [lwa][/s2If] [s2If current_user_can(access_s2member_level1)]
- USD/CAD reverses an intraday dip and climbs to a fresh weekly high on Wednesday.
- Tumbling Crude Oil prices undermines the Loonie and acts as a tailwind for the major.
- Broad-based USD weakness keeps a lid on the pair ahead of the crucial FOMC decision.
The pair currently trades last at 1.36315.
The previous day high was 1.3638 while the previous day low was 1.3529. The daily 38.2% Fib levels comes at 1.3596, expected to provide support. Similarly, the daily 61.8% fib level is at 1.357, expected to provide support.
The USD/CAD pair attracts some dip-buying near the 1.3600 round-figure mark on Wednesday and touches a fresh weekly high during the early part of the North American session. Spot prices, however, struggle to capitalize on the move and trade around the 1.3625-1.3630 region, nearly unchanged for the day.
Crude Oil prices remain under heavy selling pressure for the third straight day and dive to the lowest level since March 27 amid concerns over economic headwinds stemming from rising borrowing costs, which could dent fuel demand. This, in turn, is seen weighing on the commodity-linked Loonie and lending some support to the USD/CAD pair. That said, the ongoing US Dollar (USD) retracement slide from a three-week high touched on Tuesday keeps a lid on any meaningful upside, at least for the time being.
Worries about the US debt ceiling, along with renewed fears of a full-blown banking crisis, drag the US Treasury bond yields lower and continue to exert pressure on the buck. Apart from this, a slight recovery in the global risk sentiment – as depicted by a positive tone around the equity markets – further undermines the safe-haven Greenback. The USD bulls, meanwhile, seem rather unimpressed by the upbeat US ADP report, which showed that private-sector employers added 296K jobs in April against the 148K anticipated.
Traders also seem reluctant to place aggressive bets around the USD/CAD pair and prefer to wait on the sidelines ahead of the highly-anticipated FOMC monetary policy decision, due later during the US session. The market focus will remain glued to the accompanying policy statement and Fed Chair Jerome Powell’s comments at the post-meeting presser. Investors will look for clues about the future rate-hike path, which will drive the USD and help determine the near-term trajectory for the USD/CAD pair.
Heading into the key central bank event risk, the release of the US ISM Services PMI, along with Oil price dynamics, will be looked upon to grab short-term opportunities. Nevertheless, the aforementioned mixed fundamental backdrop makes it prudent to wait for strong follow-through buying before positioning for an extension of the overnight solid rebound from a technically significant 100-day Simple Moving Average (SMA) support.
Technical Levels: Supports and Resistances
USDCAD currently trading at 1.3632 at the time of writing. Pair opened at 1.3626 and is trading with a change of 0.04 % .
| Overview | Overview.1 | |
|---|---|---|
| 0 | Today last price | 1.3632 |
| 1 | Today Daily Change | 0.0006 |
| 2 | Today Daily Change % | 0.0400 |
| 3 | Today daily open | 1.3626 |
The pair remains strongly bullish on the daily timeframe. It trades above its 20 SMA @ 1.3498, 50 SMA 1.3589, 100 SMA @ 1.3527 and 200 SMA @ 1.3436.
| Trends | Trends.1 | |
|---|---|---|
| 0 | Daily SMA20 | 1.3498 |
| 1 | Daily SMA50 | 1.3589 |
| 2 | Daily SMA100 | 1.3527 |
| 3 | Daily SMA200 | 1.3436 |
The previous day high was 1.3638 while the previous day low was 1.3529. The daily 38.2% Fib levels comes at 1.3596, expected to provide support. Similarly, the daily 61.8% fib level is at 1.357, expected to provide support.
Note the levels of interest below:
- Pivot support is noted at 1.3557, 1.3488, 1.3448
- Pivot resistance is noted at 1.3666, 1.3706, 1.3775
| Levels | Levels.1 |
|---|---|
| Previous Daily High | 1.3638 |
| Previous Daily Low | 1.3529 |
| Previous Weekly High | 1.3668 |
| Previous Weekly Low | 1.3523 |
| Previous Monthly High | 1.3668 |
| Previous Monthly Low | 1.3301 |
| Daily Fibonacci 38.2% | 1.3596 |
| Daily Fibonacci 61.8% | 1.3570 |
| Daily Pivot Point S1 | 1.3557 |
| Daily Pivot Point S2 | 1.3488 |
| Daily Pivot Point S3 | 1.3448 |
| Daily Pivot Point R1 | 1.3666 |
| Daily Pivot Point R2 | 1.3706 |
| Daily Pivot Point R3 | 1.3775 |
[/s2If]
Nehcap Expert Advisor
The NEHCAP MT4 EA is high quality professional trading system geared to generate returns without using GRID or martingales. Each trade has strict risk per trade parameter. The pairs under management include EURUSD, GBPUSD, AUDCAD, AUDNZD,GBPAUD, EURAUD, EURCAD, CHFJPY and many more.
The system is trading live: LIVE ACCOUNT TRACKING
You can run it free. Apply for a free trial and track our account. Buy the system or use profit share mechanism to generate returns on your MT4.
Join Our Telegram Group
")


