#NZDUSD @ 0.62101 takes offers to snap two-day uptrend, reverses from the highest levels in three weeks., @nehcap view: Further downside expected (Pivot Orderbook analysis)
…
This is a premium post.
[s2If !current_user_can(access_s2member_level4)]Please register for FREE REGISTER to read full post below containing analysis. In case of any error or you think you are not able to read the full post below, please email us at support#nehcap.com [lwa][/s2If] [s2If current_user_can(access_s2member_level1)]
- NZD/USD takes offers to snap two-day uptrend, reverses from the highest levels in three weeks.
- Weekly support line, one-month-old previous resistance line restrict immediate downside.
- Failure to cross 50% Fibonacci retracement, looming bear cross on MACD favor Kiwi sellers.
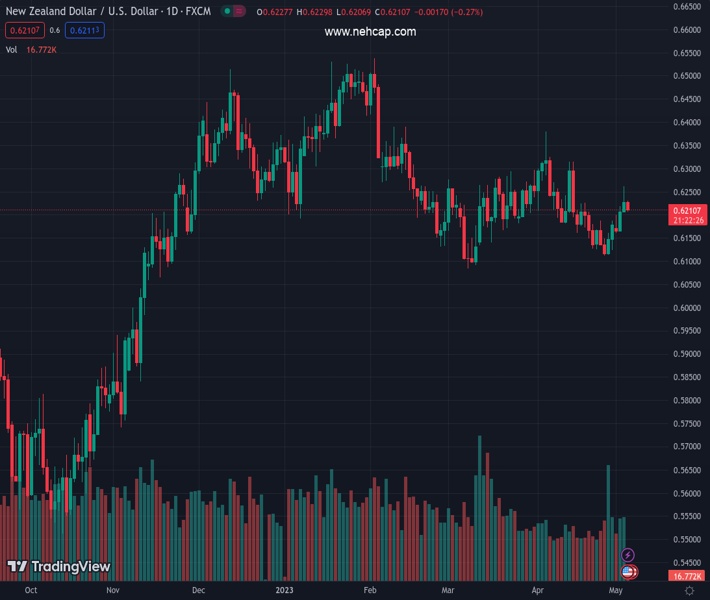
The pair currently trades last at 0.62101.
The previous day high was 0.6219 while the previous day low was 0.6163. The daily 38.2% Fib levels comes at 0.6198, expected to provide support. Similarly, the daily 61.8% fib level is at 0.6184, expected to provide support.
NZD/USD takes offers to refresh intraday low near 0.6210 as it reverses the Fed-inspired gains during early Thursday amid a risk-off mood, as well as due to the anxiety ahead of China Caixin Manufacturing PMI for April.
Technically, the Kiwi pair’s inability to cross the 50% Fibonacci retracement of its April 05-26 downside, near 0.6250, joins an impending bear cross on the MACD indicator to lure the sellers.
Adding strength to the bearish bias could be the recent downside break of the 200-SMA, around 0.6215 at the latest.
With this, the Kiwi pair is all set to drop toward the weekly support line of near 0.6200. However, the resistance-turned-support line from early April, near 0.6175 by the press time, could restrict the NZD/USD pair’s further downside.
Should the quote remains weak past 0.6175, the odds of witnessing a fall toward the previous monthly low, also the Year-To-Date (YTD) bottom, near 0.6110 can’t be ruled out.
On the contrary, recovery moves may initially aim for the 200-SMA level of around 0.6215 before challenging the 50% Fibonacci retracement and the recent swing high, respectively near 0.6250 and 0.6260.
Following that, the 61.8% Fibonacci retracement, also known as the golden ratio, of near 0.6280 will precede the 0.6300 round figure and mid-April swing high of 0.6316 to prod the NZD/USD bulls.
To sum up, NZD/USD slips to the bear’s radar but the downside room appears limited.
Trend: Further downside expected
Technical Levels: Supports and Resistances
NZDUSD currently trading at 0.6212 at the time of writing. Pair opened at 0.6208 and is trading with a change of 0.06% % .
| Overview | Overview.1 | |
|---|---|---|
| 0 | Today last price | 0.6212 |
| 1 | Today Daily Change | 0.0004 |
| 2 | Today Daily Change % | 0.06% |
| 3 | Today daily open | 0.6208 |
The pair is trading above its 20 Daily moving average @ 0.6199, above its 50 Daily moving average @ 0.6207 , below its 100 Daily moving average @ 0.6283 and above its 200 Daily moving average @ 0.616
| Trends | Trends.1 | |
|---|---|---|
| 0 | Daily SMA20 | 0.6199 |
| 1 | Daily SMA50 | 0.6207 |
| 2 | Daily SMA100 | 0.6283 |
| 3 | Daily SMA200 | 0.6160 |
The previous day high was 0.6219 while the previous day low was 0.6163. The daily 38.2% Fib levels comes at 0.6198, expected to provide support. Similarly, the daily 61.8% fib level is at 0.6184, expected to provide support.
Note the levels of interest below:
- Pivot support is noted at 0.6175, 0.6141, 0.6119
- Pivot resistance is noted at 0.6231, 0.6253, 0.6287
| Levels | Levels.1 |
|---|---|
| Previous Daily High | 0.6219 |
| Previous Daily Low | 0.6163 |
| Previous Weekly High | 0.6189 |
| Previous Weekly Low | 0.6111 |
| Previous Monthly High | 0.6389 |
| Previous Monthly Low | 0.6111 |
| Daily Fibonacci 38.2% | 0.6198 |
| Daily Fibonacci 61.8% | 0.6184 |
| Daily Pivot Point S1 | 0.6175 |
| Daily Pivot Point S2 | 0.6141 |
| Daily Pivot Point S3 | 0.6119 |
| Daily Pivot Point R1 | 0.6231 |
| Daily Pivot Point R2 | 0.6253 |
| Daily Pivot Point R3 | 0.6287 |
[/s2If]
Nehcap Expert Advisor
The NEHCAP MT4 EA is high quality professional trading system geared to generate returns without using GRID or martingales. Each trade has strict risk per trade parameter. The pairs under management include EURUSD, GBPUSD, AUDCAD, AUDNZD,GBPAUD, EURAUD, EURCAD, CHFJPY and many more.
The system is trading live: LIVE ACCOUNT TRACKING
You can run it free. Apply for a free trial and track our account. Buy the system or use profit share mechanism to generate returns on your MT4.
Join Our Telegram Group
")


