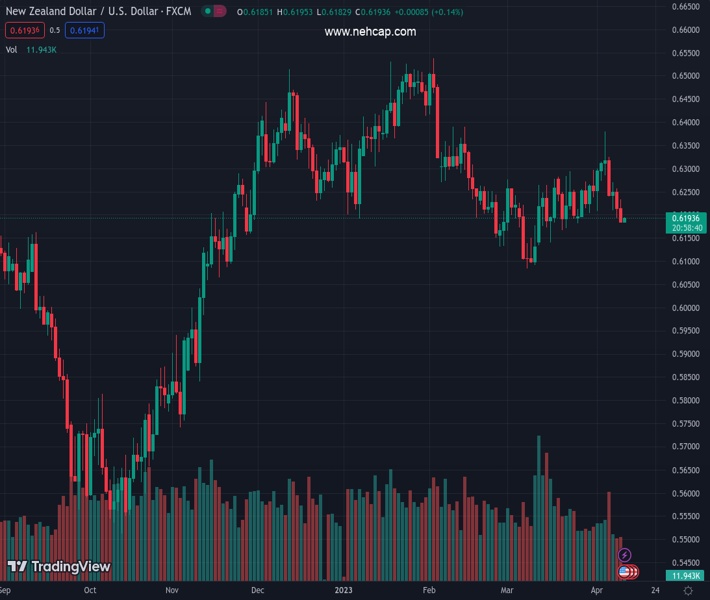
#NZDUSD @ 0.61941 A recovery attempted by looks less confident as investors are losing hope in China’s economic recovery. (Pivot Orderbook analysis)
…
This is a premium post.
[s2If !current_user_can(access_s2member_level4)]Please register for PREMIUM VERSION HERE to read full post below containing analysis. In case of any error or you think you are not able to read the full post below, please email us at support#nehcap.com [lwa][/s2If] [s2If current_user_can(access_s2member_level4)]
- A recovery attempted by NZD/USD looks less confident as investors are losing hope in China’s economic recovery.
- Investors should be prepared for sheer volatility ahead of the release of the US inflation data.
- A successful breakdown of the Rising Channel pattern has pushed the Kiwi asset into a bearish trajectory.
The pair currently trades last at 0.61941.
The previous day high was 0.6265 while the previous day low was 0.6193. The daily 38.2% Fib levels comes at 0.622, expected to provide resistance. Similarly, the daily 61.8% fib level is at 0.6237, expected to provide resistance.
The NZD/USD pair has attempted a recovery move after printing a fresh two-week low near 0.6170. The recovery move by the New Zealand Dollar looks less confident as investors are losing hopes of economic recovery in China despite dismantling lockdown curbs by the administration.
The Chinese economy is in a disinflationary process despite the announcement of various stimulus to spurt the overall demand. On Tuesday, agencies reported a monthly deflation of 0.3% in the Chinese economy while the street was expecting an acceleration in prices of goods and services by 0.1%. Annual inflation slowed to 0.7% from the former release of 1.0%.
It is worth noting that New Zealand is one of the leading trading partners of China and weak demand in China would also impact the New Zealand Dollar.
Investors should be prepared for sheer volatility ahead of the release of the United States inflation data. Meanwhile, S&P500 futures have added some gains in early Asia after a rangebound Tuesday, indicating an improvement in market sentiment. The US Dollar Index (DXY) is likely to test the immediate cushion of 102.00.
A successful breakdown of the Rising Channel chart pattern on a four-hour scale has pushed the Kiwi asset into a bearish trajectory. The 20-period Exponential Moving Average (EMA) at 0.6229 is acting as a barricade for the New Zealand Dollar bulls. Potential horizontal support is plotted from March 08 low at 0.6084.
The Relative Strength Index (RSI) (14) has shifted into the bearish range of 20.00-40.00, which indicates that the downside momentum has been triggered.
More weakness will be witnessed if the Kiwi asset surrenders April 11 low near 0.6170, which will drag the major to March 15 low at 0.6139 followed by March 08 low at 0.6084.
Alternatively, a decisive upside move above February 07 high at 0.6363 will expose the Kiwi asset to the round-level resistance at 0.6400 and December 05 high at 0.6443.
Technical Levels: Supports and Resistances
NZDUSD currently trading at 0.6193 at the time of writing. Pair opened at 0.6217 and is trading with a change of -0.39 % .
| Overview | Overview.1 | |
|---|---|---|
| 0 | Today last price | 0.6193 |
| 1 | Today Daily Change | -0.0024 |
| 2 | Today Daily Change % | -0.3900 |
| 3 | Today daily open | 0.6217 |
The pair is trading below its 20 Daily moving average @ 0.6243, below its 50 Daily moving average @ 0.6254 , below its 100 Daily moving average @ 0.6303 and above its 200 Daily moving average @ 0.616
| Trends | Trends.1 | |
|---|---|---|
| 0 | Daily SMA20 | 0.6243 |
| 1 | Daily SMA50 | 0.6254 |
| 2 | Daily SMA100 | 0.6303 |
| 3 | Daily SMA200 | 0.6160 |
The previous day high was 0.6265 while the previous day low was 0.6193. The daily 38.2% Fib levels comes at 0.622, expected to provide resistance. Similarly, the daily 61.8% fib level is at 0.6237, expected to provide resistance.
Note the levels of interest below:
- Pivot support is noted at 0.6185, 0.6153, 0.6114
- Pivot resistance is noted at 0.6257, 0.6297, 0.6329
| Levels | Levels.1 |
|---|---|
| Previous Daily High | 0.6265 |
| Previous Daily Low | 0.6193 |
| Previous Weekly High | 0.6389 |
| Previous Weekly Low | 0.6207 |
| Previous Monthly High | 0.6298 |
| Previous Monthly Low | 0.6084 |
| Daily Fibonacci 38.2% | 0.6220 |
| Daily Fibonacci 61.8% | 0.6237 |
| Daily Pivot Point S1 | 0.6185 |
| Daily Pivot Point S2 | 0.6153 |
| Daily Pivot Point S3 | 0.6114 |
| Daily Pivot Point R1 | 0.6257 |
| Daily Pivot Point R2 | 0.6297 |
| Daily Pivot Point R3 | 0.6329 |
[/s2If]
Join Our Telegram Group
")


