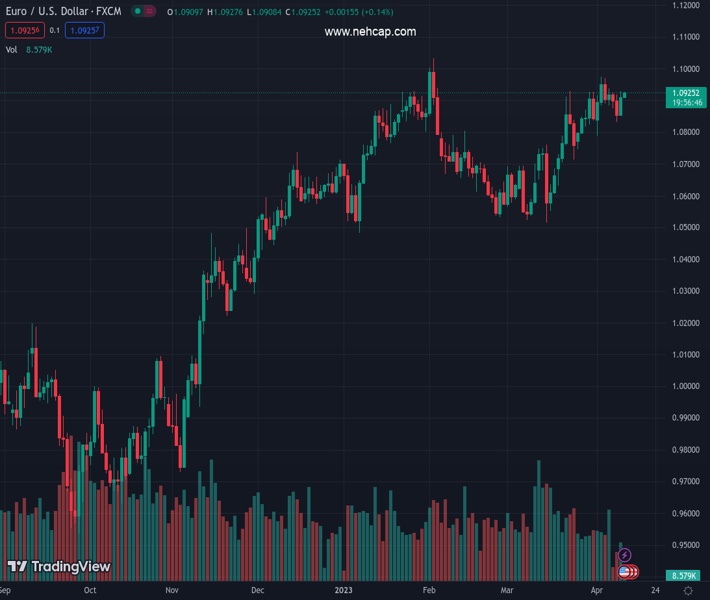
#EURUSD @ 1.09240 defends the latest bounce off a bearish chart formation’s lower line., @nehcap view: Pullback expected (Pivot Orderbook analysis)
…
This is a premium post.
[s2If !current_user_can(access_s2member_level4)]Please register for PREMIUM VERSION HERE to read full post below containing analysis. In case of any error or you think you are not able to read the full post below, please email us at support#nehcap.com [lwa][/s2If] [s2If current_user_can(access_s2member_level4)]
- EUR/USD defends the latest bounce off a bearish chart formation’s lower line.
- Looming bear cross on MACD teases Euro pair sellers inside three-week-old rising wedge.
- Bulls need validation from 1.1000-05 to renew yearly high while 50-DMA acts as an extra filter towards the south.
The pair currently trades last at 1.09240.
The previous day high was 1.0928 while the previous day low was 1.0857. The daily 38.2% Fib levels comes at 1.0901, expected to provide support. Similarly, the daily 61.8% fib level is at 1.0884, expected to provide support.
EUR/USD clings to mild gains around 1.0915-20 during Wednesday’s sluggish Asian session as traders await the all-important US Consumer Price Index (CPI) for March and the Minutes of the latest Federal Open Market Committee (FOMC) Monetary Policy Meeting.
In doing so, the Euro pair keeps the previous day’s U-turn from the lower line of a three-week-old rising wedge bearish chart pattern.
However, the impending bear cross on the MACD and the quote’s multiple failures to remain firmer past 1.0900 teases EUR/USD sellers on a key day.
That said, the pair’s pullback needs to conquer the stated bearish pattern’s support line, around 1.0870 at the latest, to confirm the rising wedge breakdown and lure the sellers.
Following that, the 50-DMA support of near 1.0735 can act as an intermediate halt during the pair’s anticipated fall toward the theoretical target of around 1.0610.
On the contrary, the monthly high of 1.0973 can lure the EUR/USD bulls but the upside remains elusive unless crossing the 1.1000-05 resistance confluence, including the stated wedge’s top line and the February 01 peak.
Also acting as an upside filter is the Year-To-Date (YTD) high marked in February around 1.1035.
Trend: Pullback expected
Technical Levels: Supports and Resistances
EURUSD currently trading at 1.0916 at the time of writing. Pair opened at 1.0912 and is trading with a change of 0.04% % .
| Overview | Overview.1 | |
|---|---|---|
| 0 | Today last price | 1.0916 |
| 1 | Today Daily Change | 0.0004 |
| 2 | Today Daily Change % | 0.04% |
| 3 | Today daily open | 1.0912 |
The pair remains strongly bullish on the daily timeframe. It trades above its 20 SMA @ 1.0819, 50 SMA 1.0736, 100 SMA @ 1.0692 and 200 SMA @ 1.0358.
| Trends | Trends.1 | |
|---|---|---|
| 0 | Daily SMA20 | 1.0819 |
| 1 | Daily SMA50 | 1.0736 |
| 2 | Daily SMA100 | 1.0692 |
| 3 | Daily SMA200 | 1.0358 |
The previous day high was 1.0928 while the previous day low was 1.0857. The daily 38.2% Fib levels comes at 1.0901, expected to provide support. Similarly, the daily 61.8% fib level is at 1.0884, expected to provide support.
Note the levels of interest below:
- Pivot support is noted at 1.087, 1.0827, 1.0798
- Pivot resistance is noted at 1.0941, 1.097, 1.1013
| Levels | Levels.1 |
|---|---|
| Previous Daily High | 1.0928 |
| Previous Daily Low | 1.0857 |
| Previous Weekly High | 1.0973 |
| Previous Weekly Low | 1.0788 |
| Previous Monthly High | 1.0930 |
| Previous Monthly Low | 1.0516 |
| Daily Fibonacci 38.2% | 1.0901 |
| Daily Fibonacci 61.8% | 1.0884 |
| Daily Pivot Point S1 | 1.0870 |
| Daily Pivot Point S2 | 1.0827 |
| Daily Pivot Point S3 | 1.0798 |
| Daily Pivot Point R1 | 1.0941 |
| Daily Pivot Point R2 | 1.0970 |
| Daily Pivot Point R3 | 1.1013 |
[/s2If]
Join Our Telegram Group
")


