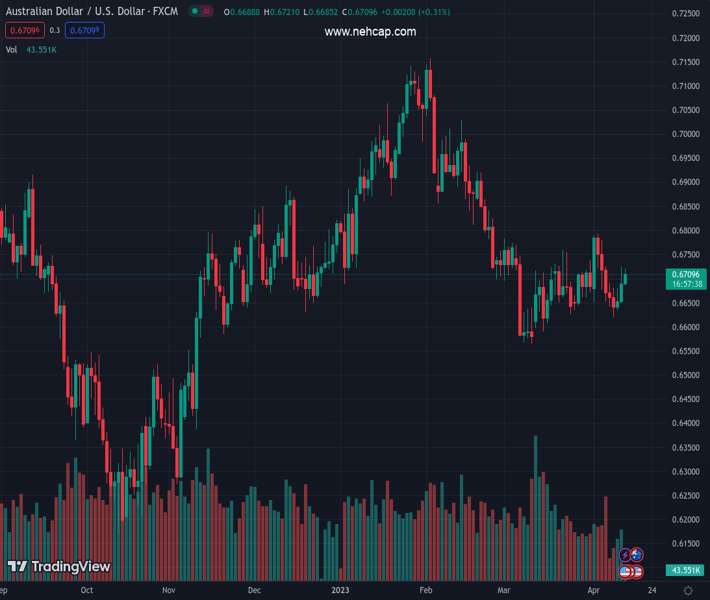
#AUDUSD @ 0.66570 has climbed above 0.6660 amid further weakness in the USD Index. (Pivot Orderbook analysis)
…
This is a premium post.
[s2If !current_user_can(access_s2member_level4)]Please register for PREMIUM VERSION HERE to read full post below containing analysis. In case of any error or you think you are not able to read the full post below, please email us at support#nehcap.com [lwa][/s2If] [s2If current_user_can(access_s2member_level4)]
- AUD/USD has climbed above 0.6660 amid further weakness in the USD Index.
- Fed’s Kashkari sees inflation at middle 3% by end of this year, closer to 2% next year.
- AUD/USD has delivered a breakdown of the Inverted Flag chart pattern.
The pair currently trades last at 0.66570.
The previous day high was 0.668 while the previous day low was 0.6632. The daily 38.2% Fib levels comes at 0.6661, expected to provide resistance. Similarly, the daily 61.8% fib level is at 0.665, expected to provide support.
The AUD/USD pair has delivered an upside break of a small consolidation above 0.6660 in the Asian session. The Aussie asset is getting traction as the US Dollar Index (DXY) has resumed its downside journey ahead of the release of the United States Consumer Price Index (CPI) data. The USD Index is likely to test the 102.00 cushion as investors are taking the release of US inflation casually.
S&P500 futures are holding nominal gains after a sideways Tuesday, portraying anxiety ahead of the quarterly result season. The demand for US government bonds has remained subdued as US inflation is expected to be a surprise for investors. The 10-year US Treasury yields is hovering around 3.43%.
Medium-term guidance on US inflation from Minneapolis Fed Bank President Neel Kashkari is weighing on the US Dollar. Fed policymaker sees inflation at middle 3% by end of this year, closer to 2% next year.
On the technical front, AUD/USD has delivered a breakdown of the Inverted Flag chart pattern formed on a four-hour scale. A breakdown of the Inverted Flag results in wider ticks and heavy volume towards the downside.
The 20-period Exponential Moving Average (EMA) at 0.6665 is acting as a barricade for the Aussie bulls.
Contrary to that, the Relative Strength Index (RSI) (14) has shifted into the 40.00-60.00 range from the bearish range of 20.00-40.00.
Going forward, more weakness will be observed on a breakdown of April 10 low at 0.6620, which will expose the Aussie asset to March 10 low at 0.6564 followed by the round-level support at 0.6500.
In an alternate scenario, a break above April 07 high at 0.6691 will drive the asset toward March 22 high at 0.6759. A breach above the latter would further drive the asset to April 03 high at 0.6693.
Technical Levels: Supports and Resistances
AUDUSD currently trading at 0.6659 at the time of writing. Pair opened at 0.6653 and is trading with a change of 0.09 % .
| Overview | Overview.1 | |
|---|---|---|
| 0 | Today last price | 0.6659 |
| 1 | Today Daily Change | 0.0006 |
| 2 | Today Daily Change % | 0.0900 |
| 3 | Today daily open | 0.6653 |
The pair remains strongly bearish on the daily time frame. It trades below the 20 SMA @ 0.6686, 50 SMA 0.6767, 100 SMA @ 0.68 and 200 SMA @ 0.6746.
| Trends | Trends.1 | |
|---|---|---|
| 0 | Daily SMA20 | 0.6686 |
| 1 | Daily SMA50 | 0.6767 |
| 2 | Daily SMA100 | 0.6800 |
| 3 | Daily SMA200 | 0.6746 |
The previous day high was 0.668 while the previous day low was 0.6632. The daily 38.2% Fib levels comes at 0.6661, expected to provide resistance. Similarly, the daily 61.8% fib level is at 0.665, expected to provide support.
Note the levels of interest below:
- Pivot support is noted at 0.663, 0.6607, 0.6582
- Pivot resistance is noted at 0.6678, 0.6703, 0.6726
| Levels | Levels.1 |
|---|---|
| Previous Daily High | 0.6680 |
| Previous Daily Low | 0.6632 |
| Previous Weekly High | 0.6793 |
| Previous Weekly Low | 0.6641 |
| Previous Monthly High | 0.6784 |
| Previous Monthly Low | 0.6564 |
| Daily Fibonacci 38.2% | 0.6661 |
| Daily Fibonacci 61.8% | 0.6650 |
| Daily Pivot Point S1 | 0.6630 |
| Daily Pivot Point S2 | 0.6607 |
| Daily Pivot Point S3 | 0.6582 |
| Daily Pivot Point R1 | 0.6678 |
| Daily Pivot Point R2 | 0.6703 |
| Daily Pivot Point R3 | 0.6726 |
[/s2If]
Join Our Telegram Group
")


