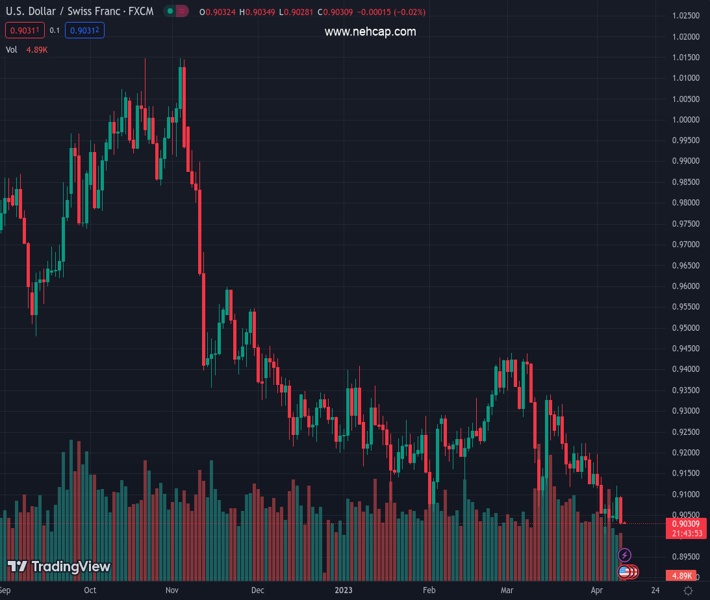
#USDCHF @ 0.90308 remains pressured towards the lowest levels since June 2021 after falling the most in a week the previous day. (Pivot Orderbook analysis)
…
This is a premium post.
[s2If !current_user_can(access_s2member_level4)]Please register for PREMIUM VERSION HERE to read full post below containing analysis. In case of any error or you think you are not able to read the full post below, please email us at support#nehcap.com [lwa][/s2If] [s2If current_user_can(access_s2member_level4)]
- USD/CHF remains pressured towards the lowest levels since June 2021 after falling the most in a week the previous day.
- Broad US Dollar weakness, cautious optimism in the markets keeps Swiss Franc pair on bear’s radar.
- US CPI for March, FOMC Minutes will be eyed closely amid recently mixed Fed talks.
The pair currently trades last at 0.90308.
The previous day high was 0.9114 while the previous day low was 0.9037. The daily 38.2% Fib levels comes at 0.9084, expected to provide resistance. Similarly, the daily 61.8% fib level is at 0.9066, expected to provide resistance.
USD/CHF slides to 0.9030 as bears keep the reins for the second consecutive day amid early Wednesday, after posting the biggest daily fall in a week the previous day. In doing so, the Swiss Franc (CHF) pair cheers the broad US Dollar weakness ahead of the key catalysts while declining towards the 22-month low marked the last week.
US Dollar Index (DXY) snapped four-day uptrend to drop to 102.15 the previous day, around the same price by the press time, as mixed Federal Reserve (Fed) comments raised doubts on the US central bank’s hawkish moves as the US inflation data and Fed Minutes loom.
That said, Philadelphia Fed President Patrick Harker said on Tuesday that the Federal Reserve will continue to look closely at available data to determine what, if any, additional actions they may need to take. Before him, Federal Reserve (Fed) Bank of New York President John Williams said that if inflation comes down, we will have to lower rates. Furthermore, Chicago Fed President Austan Goolsbee, said on Tuesday that they need to be cautious about raising interest rates after recent development in the banking sector.
It’s worth noting, however, that comments from the International Monetary Fund (IMF) seem to prod the US Dollar as the global lender flag economic fears but supports the fight against inflation. “The International Monetary Fund warned on Tuesday that lurking financial system vulnerabilities could erupt into a new crisis and slam global growth this year, but urged member countries to keep tightening monetary policy to fight persistently high inflation,” said Reuters.
On Tuesday, the IMF revised down global real Gross Domestic Product (GDP) growth forecast for 2023 to 2.8% from 2.9% in January’s report. “IMF forecasts 2023 US growth at 1.6% vs 1.4% in January; 2024 growth seen at 1.1%,” mentioned Reuters.
Against this backdrop, Wall Street closed with minor gains and the yields also marked a mild run-up while the CME’s FedWatch Tool signals 64% change of 0.25% Fed rate hike in May versus 72.0% a day before.
Unless providing a successful break of a five-week-old descending resistance line, around 0.9085, the USD/CHF pair is well set to test the June 2021 low of around 0.8925.
Technical Levels: Supports and Resistances
USDCHF currently trading at 0.9029 at the time of writing. Pair opened at 0.9095 and is trading with a change of -0.73 % .
| Overview | Overview.1 | |
|---|---|---|
| 0 | Today last price | 0.9029 |
| 1 | Today Daily Change | -0.0066 |
| 2 | Today Daily Change % | -0.7300 |
| 3 | Today daily open | 0.9095 |
The pair remains strongly bearish on the daily time frame. It trades below the 20 SMA @ 0.9167, 50 SMA 0.9233, 100 SMA @ 0.9272 and 200 SMA @ 0.9504.
| Trends | Trends.1 | |
|---|---|---|
| 0 | Daily SMA20 | 0.9167 |
| 1 | Daily SMA50 | 0.9233 |
| 2 | Daily SMA100 | 0.9272 |
| 3 | Daily SMA200 | 0.9504 |
The previous day high was 0.9114 while the previous day low was 0.9037. The daily 38.2% Fib levels comes at 0.9084, expected to provide resistance. Similarly, the daily 61.8% fib level is at 0.9066, expected to provide resistance.
Note the levels of interest below:
- Pivot support is noted at 0.905, 0.9005, 0.8973
- Pivot resistance is noted at 0.9127, 0.9159, 0.9204
| Levels | Levels.1 |
|---|---|
| Previous Daily High | 0.9114 |
| Previous Daily Low | 0.9037 |
| Previous Weekly High | 0.9198 |
| Previous Weekly Low | 0.9007 |
| Previous Monthly High | 0.9440 |
| Previous Monthly Low | 0.9072 |
| Daily Fibonacci 38.2% | 0.9084 |
| Daily Fibonacci 61.8% | 0.9066 |
| Daily Pivot Point S1 | 0.9050 |
| Daily Pivot Point S2 | 0.9005 |
| Daily Pivot Point S3 | 0.8973 |
| Daily Pivot Point R1 | 0.9127 |
| Daily Pivot Point R2 | 0.9159 |
| Daily Pivot Point R3 | 0.9204 |
[/s2If]
Join Our Telegram Group
")


