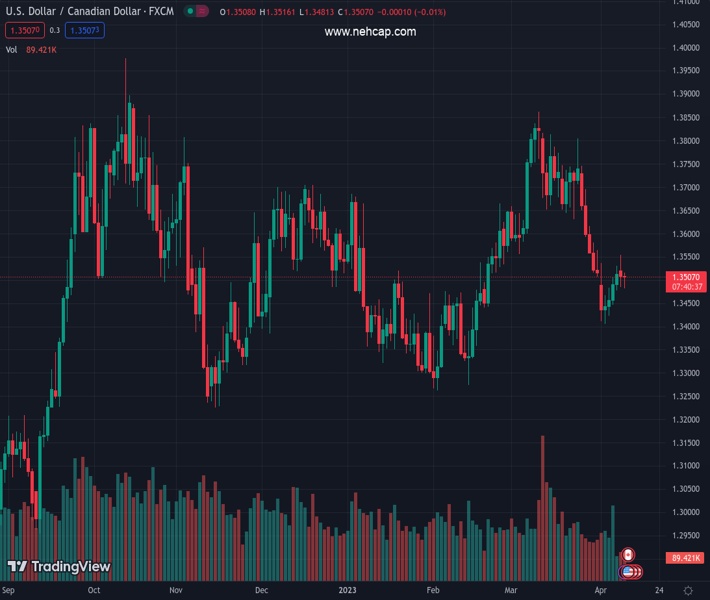
#USDCAD @ 1.35061 reverses an intraday dip and climbs back above the 1.3500 mark. (Pivot Orderbook analysis)
…
This is a premium post.
[s2If !current_user_can(access_s2member_level4)]Please register for PREMIUM VERSION HERE to read full post below containing analysis. In case of any error or you think you are not able to read the full post below, please email us at support#nehcap.com [lwa][/s2If] [s2If current_user_can(access_s2member_level4)]
- USD/CAD reverses an intraday dip and climbs back above the 1.3500 mark.
- Softer Oil prices undermine the Loonie and act as a tailwind for the major.
- A positive risk tone weighs on the safe-haven USD and might cap the upside.
The pair currently trades last at 1.35061.
The previous day high was 1.3554 while the previous day low was 1.3485. The daily 38.2% Fib levels comes at 1.3511, expected to provide resistance. Similarly, the daily 61.8% fib level is at 1.3528, expected to provide resistance.
The USD/CAD pair attracts some buyers near the 1.3480 region on Tuesday and for now, seems to have stalled the overnight retracement slide from over a one-week high. Spot prices climb back above the 1.3500 psychological mark during the early North American session, albeit the intraday uptick lacks bullish conviction.
Crude Oil prices languish near a one-week low, which, in turn, is seen undermining the commodity-linked Loonie and lending some support to the USD/CAD pair. Data released earlier today showed China’s consumer inflation hit an 18-month low and producer price inflation contracted at a steady pace. This suggested that a post-COVID recovery in the world’s second-largest economy was losing steam and raised concerns about a recovery in fuel demand.
The upside for the USD/CAD pair, however, remains capped amid the emergence of fresh selling around the US Dollar (USD). A generally positive tone around the equity markets dents the Greenback’s relative safe-haven status, though speculations that the Federal Reserve (Fed) may continue raising interest rates should help limit the downside. In fact, the markets are now pricing in a greater chance of another 25 bps lift-off at the next FOMC meeting in May.
The bets were lifted by the mostly upbeat US monthly employment details (NFP) released on Friday, which, for the time being, puts a floor under the US Treasury bond yields and could act as a tailwind for the USD. This, in turn, supports prospects for the resumption of the USD/CAD pair’s recent recovery move from the 1.3400 mark, or its lowest level since February 16 touched last week. Traders, however, seem reluctant ahead of this week’s key event/data risks.
The Bank of Canada (BoC) is scheduled to announce its monetary policy decision on Wednesday, which will be accompanied by the release of the latest consumer inflation figures from the US. The market focus, meanwhile, will remain glued to the FOMC meeting minutes, also due on Wednesday. This, along with the US monthly Retail Sales data on Friday, will play a key role in influencing the USD and provide a fresh directional impetus to the USD/CAD pair.
Technical Levels: Supports and Resistances
USDCAD currently trading at 1.3506 at the time of writing. Pair opened at 1.3509 and is trading with a change of -0.02 % .
| Overview | Overview.1 | |
|---|---|---|
| 0 | Today last price | 1.3506 |
| 1 | Today Daily Change | -0.0003 |
| 2 | Today Daily Change % | -0.0200 |
| 3 | Today daily open | 1.3509 |
The pair is trading below its 20 Daily moving average @ 1.361, below its 50 Daily moving average @ 1.3557 , below its 100 Daily moving average @ 1.3529 and above its 200 Daily moving average @ 1.3393
| Trends | Trends.1 | |
|---|---|---|
| 0 | Daily SMA20 | 1.3610 |
| 1 | Daily SMA50 | 1.3557 |
| 2 | Daily SMA100 | 1.3529 |
| 3 | Daily SMA200 | 1.3393 |
The previous day high was 1.3554 while the previous day low was 1.3485. The daily 38.2% Fib levels comes at 1.3511, expected to provide resistance. Similarly, the daily 61.8% fib level is at 1.3528, expected to provide resistance.
Note the levels of interest below:
- Pivot support is noted at 1.3478, 1.3447, 1.3409
- Pivot resistance is noted at 1.3547, 1.3585, 1.3616
| Levels | Levels.1 |
|---|---|
| Previous Daily High | 1.3554 |
| Previous Daily Low | 1.3485 |
| Previous Weekly High | 1.3537 |
| Previous Weekly Low | 1.3406 |
| Previous Monthly High | 1.3862 |
| Previous Monthly Low | 1.3508 |
| Daily Fibonacci 38.2% | 1.3511 |
| Daily Fibonacci 61.8% | 1.3528 |
| Daily Pivot Point S1 | 1.3478 |
| Daily Pivot Point S2 | 1.3447 |
| Daily Pivot Point S3 | 1.3409 |
| Daily Pivot Point R1 | 1.3547 |
| Daily Pivot Point R2 | 1.3585 |
| Daily Pivot Point R3 | 1.3616 |
[/s2If]
Join Our Telegram Group
")


