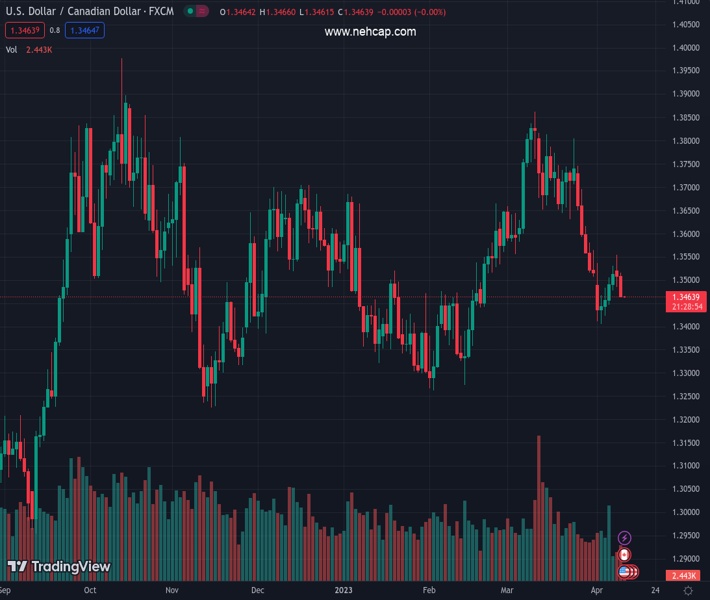
#USDCAD @ 1.34635 is declining towards 1.3450 as the market mood is upbeat ahead of US inflation. (Pivot Orderbook analysis)
…
This is a premium post.
[s2If !current_user_can(access_s2member_level4)]Please register for PREMIUM VERSION HERE to read full post below containing analysis. In case of any error or you think you are not able to read the full post below, please email us at support#nehcap.com [lwa][/s2If] [s2If current_user_can(access_s2member_level4)]
- USD/CAD is declining towards 1.3450 as the market mood is upbeat ahead of US inflation.
- BoC Macklem is expected to keep rates steady at 4.5% as Canada’s inflation is softening consistently.
- Fed policymakers are cautioning for considering more rate hikes ahead.
The pair currently trades last at 1.34635.
The previous day high was 1.3554 while the previous day low was 1.3485. The daily 38.2% Fib levels comes at 1.3511, expected to provide resistance. Similarly, the daily 61.8% fib level is at 1.3528, expected to provide resistance.
The USD/CAD pair is expected to see more weakness to near 1.3450 amid a cheerful market mood. Investors seem calm before the storm of United States inflation data as the Federal Reserve’s (Fed) terminal rate is around the corner. The Loonie asset is expected to remain in action as the Bank of Canada (BoC) will announce the interest rate decision ahead.
S&P500 futures have added nominal gains in early Asia after a choppy Tuesday, portraying further improvement in investors’ risk appetite. The US Dollar Index (DXY) has dropped after failing to extend its recovery above 102.30. The USD Index is likely to revert to its immediate support of 102.00 as Fed policymakers are cautioning about considering a more restrictive policy.
Chicago Fed President Austan Goolsbee has advised a cautious approach as the combination of tight credit conditions and further restrictive monetary policy can hit sectors and regions differently than if monetary policy was acting on its own.
Also, Philadelphia Fed President Patrick Harker cited “I am keeping an eye on the data to see if more action on inflation is required.” He further added, “It can take up to 18 months for the full impact of monetary policy actions to be felt.
Going forward, the release of the US inflation data will be the key event. Analysts at Commerzbank expect “Statisticians are likely to report a drop in the inflation rate from 6.0% in February to 5.3% in March. However, the March decline is entirely due to the fact that prices are now being compared with those in March 2022, when energy prices in particular had already risen significantly due to the Ukraine war. While core inflation is expected to increase from 5.5% to 5.7%”
On the Canadian Dollar front, BoC Governor Tiff Macklem is expected to keep rates steady at 4.5% as Canada’s inflation is softening consistently.
Technical Levels: Supports and Resistances
USDCAD currently trading at 1.3462 at the time of writing. Pair opened at 1.3509 and is trading with a change of -0.35 % .
| Overview | Overview.1 | |
|---|---|---|
| 0 | Today last price | 1.3462 |
| 1 | Today Daily Change | -0.0047 |
| 2 | Today Daily Change % | -0.3500 |
| 3 | Today daily open | 1.3509 |
The pair is trading below its 20 Daily moving average @ 1.361, below its 50 Daily moving average @ 1.3557 , below its 100 Daily moving average @ 1.3529 and above its 200 Daily moving average @ 1.3393
| Trends | Trends.1 | |
|---|---|---|
| 0 | Daily SMA20 | 1.3610 |
| 1 | Daily SMA50 | 1.3557 |
| 2 | Daily SMA100 | 1.3529 |
| 3 | Daily SMA200 | 1.3393 |
The previous day high was 1.3554 while the previous day low was 1.3485. The daily 38.2% Fib levels comes at 1.3511, expected to provide resistance. Similarly, the daily 61.8% fib level is at 1.3528, expected to provide resistance.
Note the levels of interest below:
- Pivot support is noted at 1.3478, 1.3447, 1.3409
- Pivot resistance is noted at 1.3547, 1.3585, 1.3616
| Levels | Levels.1 |
|---|---|
| Previous Daily High | 1.3554 |
| Previous Daily Low | 1.3485 |
| Previous Weekly High | 1.3537 |
| Previous Weekly Low | 1.3406 |
| Previous Monthly High | 1.3862 |
| Previous Monthly Low | 1.3508 |
| Daily Fibonacci 38.2% | 1.3511 |
| Daily Fibonacci 61.8% | 1.3528 |
| Daily Pivot Point S1 | 1.3478 |
| Daily Pivot Point S2 | 1.3447 |
| Daily Pivot Point S3 | 1.3409 |
| Daily Pivot Point R1 | 1.3547 |
| Daily Pivot Point R2 | 1.3585 |
| Daily Pivot Point R3 | 1.3616 |
[/s2If]
Join Our Telegram Group
")


