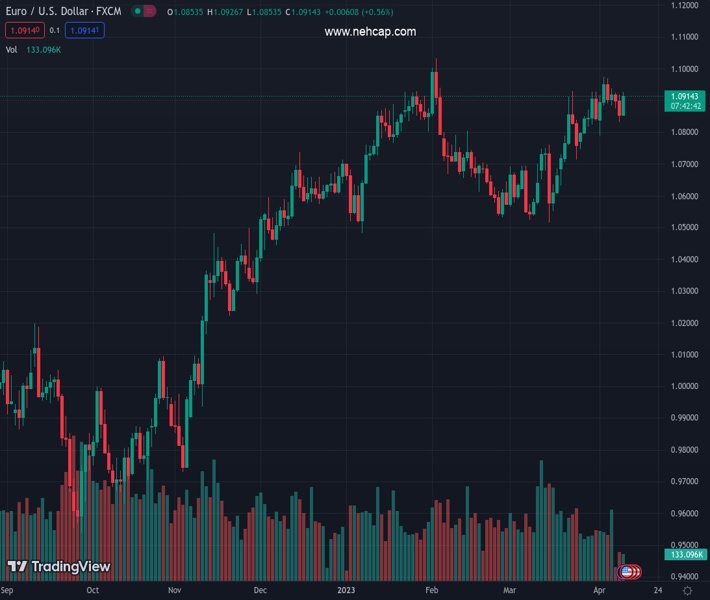
#EURUSD @ 1.09136 reverses part of the recent decline and retakes 1.0900. (Pivot Orderbook analysis)
…
This is a premium post.
[s2If !current_user_can(access_s2member_level4)]Please register for PREMIUM VERSION HERE to read full post below containing analysis. In case of any error or you think you are not able to read the full post below, please email us at support#nehcap.com [lwa][/s2If] [s2If current_user_can(access_s2member_level4)]
- EUR/USD reverses part of the recent decline and retakes 1.0900.
- Further rebound could see the April high near 1.0973 revisited.
The pair currently trades last at 1.09136.
The previous day high was 1.0917 while the previous day low was 1.0837. The daily 38.2% Fib levels comes at 1.0868, expected to provide support. Similarly, the daily 61.8% fib level is at 1.0887, expected to provide support.
EUR/USD leaves behind two consecutive sessions with losses and advances past 1.0900 the figure on Tuesday.
The likelihood of extra advances appears favoured for the time being. Against that, the pair needs to clear the April high at 1.0973 (April 4) to put the key 1.1000 mark back on the radar and then challenge the YTD peak at 1.1032 (February 2).
Looking at the longer run, the constructive view remains unchanged while above the 200-day SMA, today at 1.0356.
Technical Levels: Supports and Resistances
EURUSD currently trading at 1.0912 at the time of writing. Pair opened at 1.0861 and is trading with a change of 0.47 % .
| Overview | Overview.1 | |
|---|---|---|
| 0 | Today last price | 1.0912 |
| 1 | Today Daily Change | 73.0000 |
| 2 | Today Daily Change % | 0.4700 |
| 3 | Today daily open | 1.0861 |
The pair remains strongly bullish on the daily timeframe. It trades above its 20 SMA @ 1.081, 50 SMA 1.0735, 100 SMA @ 1.0685 and 200 SMA @ 1.0355.
| Trends | Trends.1 | |
|---|---|---|
| 0 | Daily SMA20 | 1.0810 |
| 1 | Daily SMA50 | 1.0735 |
| 2 | Daily SMA100 | 1.0685 |
| 3 | Daily SMA200 | 1.0355 |
The previous day high was 1.0917 while the previous day low was 1.0837. The daily 38.2% Fib levels comes at 1.0868, expected to provide support. Similarly, the daily 61.8% fib level is at 1.0887, expected to provide support.
Note the levels of interest below:
- Pivot support is noted at 1.0827, 1.0792, 1.0747
- Pivot resistance is noted at 1.0907, 1.0952, 1.0987
| Levels | Levels.1 |
|---|---|
| Previous Daily High | 1.0917 |
| Previous Daily Low | 1.0837 |
| Previous Weekly High | 1.0973 |
| Previous Weekly Low | 1.0788 |
| Previous Monthly High | 1.0930 |
| Previous Monthly Low | 1.0516 |
| Daily Fibonacci 38.2% | 1.0868 |
| Daily Fibonacci 61.8% | 1.0887 |
| Daily Pivot Point S1 | 1.0827 |
| Daily Pivot Point S2 | 1.0792 |
| Daily Pivot Point S3 | 1.0747 |
| Daily Pivot Point R1 | 1.0907 |
| Daily Pivot Point R2 | 1.0952 |
| Daily Pivot Point R3 | 1.0987 |
[/s2If]
Join Our Telegram Group
")


