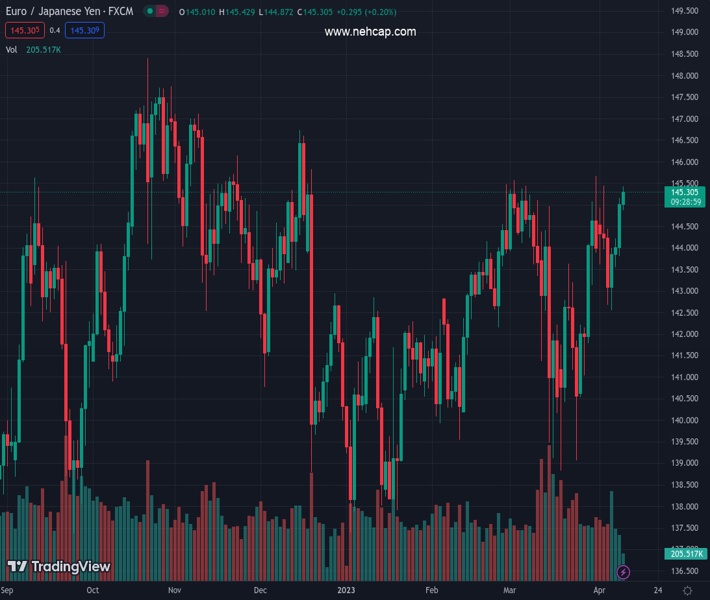
#EURJPY @ 145.313 adds to the ongoing rally beyond 145.00. (Pivot Orderbook analysis)
…
This is a premium post.
[s2If !current_user_can(access_s2member_level4)]Please register for PREMIUM VERSION HERE to read full post below containing analysis. In case of any error or you think you are not able to read the full post below, please email us at support#nehcap.com [lwa][/s2If] [s2If current_user_can(access_s2member_level4)]
- EUR/JPY adds to the ongoing rally beyond 145.00.
- Next on the upside comes the 2023 high near 145.70.
The pair currently trades last at 145.313.
The previous day high was 145.16 while the previous day low was 143.8. The daily 38.2% Fib levels comes at 144.64, expected to provide support. Similarly, the daily 61.8% fib level is at 144.32, expected to provide support.
EUR/JPY advances for the fourth session in a row and breaks above the key barrier at 145.00 on Tuesday.
The continuation of the recovery should encourage the cross to challenge the 2023 top at 145.67 (March 31). The surpass of this level could put a potential test of the December 2022 high near 146.70 (December 15) back on the radar in the not-so-distant future.
So far, further upside looks favoured while the cross trades above the 200-day SMA, today at 141.89.
Technical Levels: Supports and Resistances
EURJPY currently trading at 145.33 at the time of writing. Pair opened at 145.0 and is trading with a change of 0.23 % .
| Overview | Overview.1 | |
|---|---|---|
| 0 | Today last price | 145.33 |
| 1 | Today Daily Change | 55.00 |
| 2 | Today Daily Change % | 0.23 |
| 3 | Today daily open | 145.00 |
The pair remains strongly bullish on the daily timeframe. It trades above its 20 SMA @ 142.88, 50 SMA 142.95, 100 SMA @ 142.5 and 200 SMA @ 141.9.
| Trends | Trends.1 | |
|---|---|---|
| 0 | Daily SMA20 | 142.88 |
| 1 | Daily SMA50 | 142.95 |
| 2 | Daily SMA100 | 142.50 |
| 3 | Daily SMA200 | 141.90 |
The previous day high was 145.16 while the previous day low was 143.8. The daily 38.2% Fib levels comes at 144.64, expected to provide support. Similarly, the daily 61.8% fib level is at 144.32, expected to provide support.
Note the levels of interest below:
- Pivot support is noted at 144.15, 143.3, 142.8
- Pivot resistance is noted at 145.5, 146.0, 146.85
| Levels | Levels.1 |
|---|---|
| Previous Daily High | 145.16 |
| Previous Daily Low | 143.80 |
| Previous Weekly High | 145.44 |
| Previous Weekly Low | 142.55 |
| Previous Monthly High | 145.67 |
| Previous Monthly Low | 138.83 |
| Daily Fibonacci 38.2% | 144.64 |
| Daily Fibonacci 61.8% | 144.32 |
| Daily Pivot Point S1 | 144.15 |
| Daily Pivot Point S2 | 143.30 |
| Daily Pivot Point S3 | 142.80 |
| Daily Pivot Point R1 | 145.50 |
| Daily Pivot Point R2 | 146.00 |
| Daily Pivot Point R3 | 146.85 |
[/s2If]
Join Our Telegram Group
")


