#USDJPY @ 131.448 takes offers to refresh intraday low, drops for the third consecutive day., @nehcap view: Further downside expected (Pivot Orderbook analysis)
…
This is a premium post.
[s2If !current_user_can(access_s2member_level4)]Please register for PREMIUM VERSION HERE to read full post below containing analysis. In case of any error or you think you are not able to read the full post below, please email us at support#nehcap.com [lwa][/s2If] [s2If current_user_can(access_s2member_level4)]
- USD/JPY takes offers to refresh intraday low, drops for the third consecutive day.
- Clear U-turn from the key DMAs, unimpressive oscillators keep sellers hopeful.
- Ascending trend line from mid-January lures bears; bulls remain off the table below 134.00.
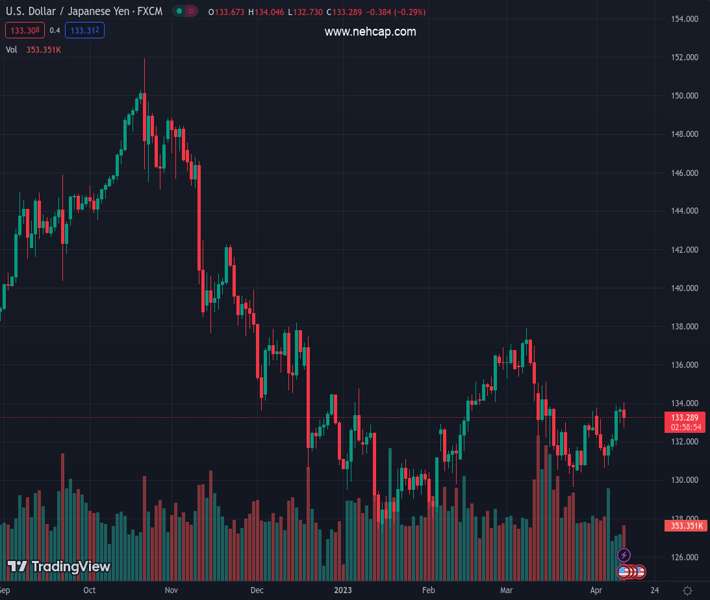
The pair currently trades last at 131.448.
The previous day high was 133.76 while the previous day low was 132.2. The daily 38.2% Fib levels comes at 132.8, expected to provide resistance. Similarly, the daily 61.8% fib level is at 133.16, expected to provide resistance.
USD/JPY takes offers to refresh the intraday low near 131.40 as Tokyo opens on Wednesday. In doing so, the yen pair drops for the third consecutive day after reversing from the 100-DMA during the last week.
Not only the U-turn from the 100-DMA but a following downturn past convergence of the 50-DMA and 23.6% Fibonacci retracement level of its October 2022 to January 2023 fall, around 133.05 at the latest, also keep USD/JPY bears hopeful.
Adding strength to the downside bias is the steady RSI (14) and sluggish MACD signals.
However, the RSI level is below the 50 mark and hence suggests the dip-buying, which in turn highlights an upward-sloping support line from January 16, close to 130.70 at the key level to watch for the USD/JPY bears.
Should the quote drop below 130.70, the odds of witnessing a break of the 13.0.00 psychological magnet can’t be ruled out.
Alternatively, the aforementioned resistance confluence of around 133.05, comprising 50-DMA and 23.6% Fibonacci retracement, restricts short-term advances of the USD/JPY pair.
Following that, the 100-DMA and a downward-sloping trend line from late October 2022, respectively near 133.65 and 135.00 in that order, could challenge the Yen pair buyers.
It’s worth noting, however, that the USD/JPY run-up beyond 135.00 won’t hesitate to challenge the Year-To-Date (YTD) high surrounding 137.90.
Trend: Further downside expected
Technical Levels: Supports and Resistances
USDJPY currently trading at 131.51 at the time of writing. Pair opened at 132.41 and is trading with a change of -0.68% % .
| Overview | Overview.1 | |
|---|---|---|
| 0 | Today last price | 131.51 |
| 1 | Today Daily Change | -0.90 |
| 2 | Today Daily Change % | -0.68% |
| 3 | Today daily open | 132.41 |
The pair remains strongly bearish on the daily time frame. It trades below the 20 SMA @ 132.82, 50 SMA 133.01, 100 SMA @ 133.72 and 200 SMA @ 137.28.
| Trends | Trends.1 | |
|---|---|---|
| 0 | Daily SMA20 | 132.82 |
| 1 | Daily SMA50 | 133.01 |
| 2 | Daily SMA100 | 133.72 |
| 3 | Daily SMA200 | 137.28 |
The previous day high was 133.76 while the previous day low was 132.2. The daily 38.2% Fib levels comes at 132.8, expected to provide resistance. Similarly, the daily 61.8% fib level is at 133.16, expected to provide resistance.
Note the levels of interest below:
- Pivot support is noted at 131.82, 131.24, 130.27
- Pivot resistance is noted at 133.38, 134.34, 134.93
| Levels | Levels.1 |
|---|---|
| Previous Daily High | 133.76 |
| Previous Daily Low | 132.20 |
| Previous Weekly High | 133.60 |
| Previous Weekly Low | 130.41 |
| Previous Monthly High | 137.91 |
| Previous Monthly Low | 129.64 |
| Daily Fibonacci 38.2% | 132.80 |
| Daily Fibonacci 61.8% | 133.16 |
| Daily Pivot Point S1 | 131.82 |
| Daily Pivot Point S2 | 131.24 |
| Daily Pivot Point S3 | 130.27 |
| Daily Pivot Point R1 | 133.38 |
| Daily Pivot Point R2 | 134.34 |
| Daily Pivot Point R3 | 134.93 |
[/s2If]
Join Our Telegram Group
")


