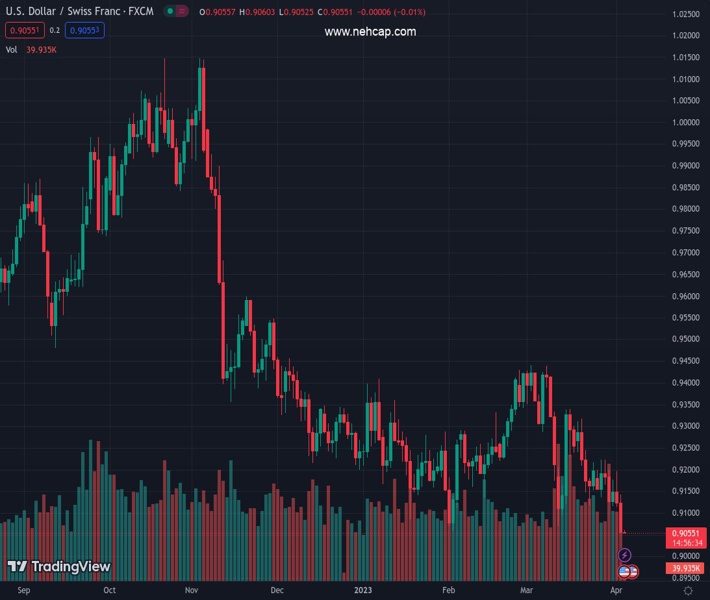
#USDCHF @ 0.90541 seesaws around 20-month low, snaps two-day downtrend amid sluggish markets. (Pivot Orderbook analysis)
…
This is a premium post.
[s2If !current_user_can(access_s2member_level4)]Please register for PREMIUM VERSION HERE to read full post below containing analysis. In case of any error or you think you are not able to read the full post below, please email us at support#nehcap.com [lwa][/s2If] [s2If current_user_can(access_s2member_level4)]
- USD/CHF seesaws around 20-month low, snaps two-day downtrend amid sluggish markets.
- Cautious mood ahead of top-tier US data, corrective bounce in yields allow Swiss Franc pair to stabilize at multi-month low.
- Downbeat US data, challenges to USD’s reserve currency status challenge weigh on USD/CHF pair.
The pair currently trades last at 0.90541.
The previous day high was 0.9143 while the previous day low was 0.9055. The daily 38.2% Fib levels comes at 0.9089, expected to provide resistance. Similarly, the daily 61.8% fib level is at 0.9109, expected to provide resistance.
USD/CHF makes rounds to 0.9050-60 heading into Wednesday’s European session as traders seek more clues to extend the two-day downtrend at the lowest levels since August 2021. In doing so, the Swiss Franc (CHF) pair traces a corrective bounce in the US Treasury bond yields ahead of the key US employment and PMI data.
While portraying the bond market moves, the US 10-year and two-year Treasury bond yields take a breather around 3.35% and 3.86% respectively, after falling in the last five and three consecutive days. It’s worth noting that downbeat US employment clues joined previously easing hawkish Fed bias to weigh on the US bond coupons.
It should be noted that the downbeat US JOLTS Job Openings and Factory Orders for February weigh on the US Dollar. On the same line could be Russia’s likes for the Chinese Yuan and the China-Brazil pact to ignore the US Dollar as an intermediate currency.
On a different page, the recent hawkish comments from Federal Reserve Bank of Cleveland leader Loretta Mester join the cautious mood before the US ISM Services PMI and ADP Employment Change to allow the yields and the US Dollar to stabilize, especially amid off in China.
Against this backdrop, S&P 500 Futures struggle for clear directions near 4,130 while yields and the US Dollar lick their wounds.
Moving on, USD/CHF may witness further consolidation ahead of the aforementioned US data. However, the likely downbeat outcome of the US statistics may drown the pair prices afterward.
Also read: US ADP Jobs/ISM Service PMI Preview: Slowing but still positive
A clear downside break of the key ascending support line from early February, now immediate resistance near 0.9080, joins bearish MACD signals to direct USD/CHF bears towards the August 2021 bottom of around 0.9020 and the 0.9000 round figure.
Technical Levels: Supports and Resistances
USDCHF currently trading at 0.9059 at the time of writing. Pair opened at 0.9059 and is trading with a change of 0.00% % .
| Overview | Overview.1 | |
|---|---|---|
| 0 | Today last price | 0.9059 |
| 1 | Today Daily Change | 0.0000 |
| 2 | Today Daily Change % | 0.00% |
| 3 | Today daily open | 0.9059 |
The pair remains strongly bearish on the daily time frame. It trades below the 20 SMA @ 0.9208, 50 SMA 0.9245, 100 SMA @ 0.9291 and 200 SMA @ 0.9514.
| Trends | Trends.1 | |
|---|---|---|
| 0 | Daily SMA20 | 0.9208 |
| 1 | Daily SMA50 | 0.9245 |
| 2 | Daily SMA100 | 0.9291 |
| 3 | Daily SMA200 | 0.9514 |
The previous day high was 0.9143 while the previous day low was 0.9055. The daily 38.2% Fib levels comes at 0.9089, expected to provide resistance. Similarly, the daily 61.8% fib level is at 0.9109, expected to provide resistance.
Note the levels of interest below:
- Pivot support is noted at 0.9028, 0.8998, 0.8941
- Pivot resistance is noted at 0.9116, 0.9174, 0.9204
| Levels | Levels.1 |
|---|---|
| Previous Daily High | 0.9143 |
| Previous Daily Low | 0.9055 |
| Previous Weekly High | 0.9224 |
| Previous Weekly Low | 0.9116 |
| Previous Monthly High | 0.9440 |
| Previous Monthly Low | 0.9072 |
| Daily Fibonacci 38.2% | 0.9089 |
| Daily Fibonacci 61.8% | 0.9109 |
| Daily Pivot Point S1 | 0.9028 |
| Daily Pivot Point S2 | 0.8998 |
| Daily Pivot Point S3 | 0.8941 |
| Daily Pivot Point R1 | 0.9116 |
| Daily Pivot Point R2 | 0.9174 |
| Daily Pivot Point R3 | 0.9204 |
[/s2If]
Join Our Telegram Group
")


