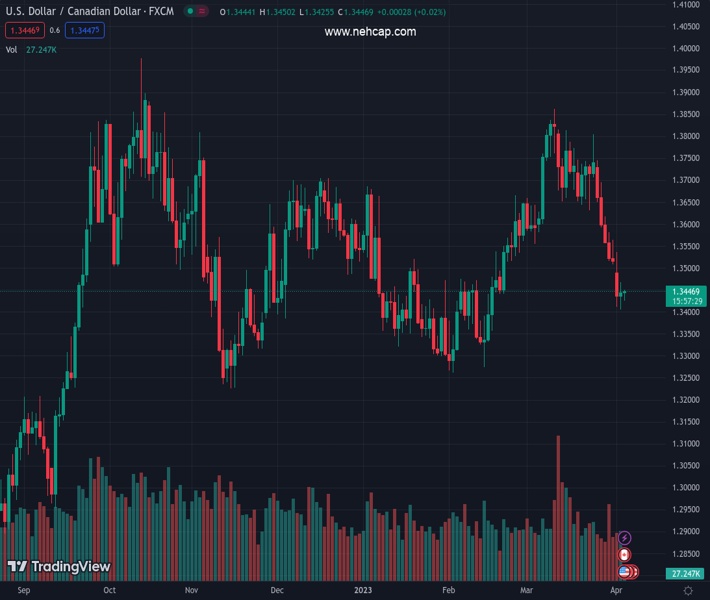
#USDCAD @ 1.34472 has shown a decent rebound to near 1.3450 supported by firmer US Yields. (Pivot Orderbook analysis)
…
This is a premium post.
[s2If !current_user_can(access_s2member_level4)]Please register for PREMIUM VERSION HERE to read full post below containing analysis. In case of any error or you think you are not able to read the full post below, please email us at support#nehcap.com [lwa][/s2If] [s2If current_user_can(access_s2member_level4)]
- USD/CAD has shown a decent rebound to near 1.3450 supported by firmer US Yields.
- S&P500 futures have surrendered nominal gains, portraying further depletion of risk appetite.
- Weaker-than-anticipated US Employment data would put more pressure on the USD Index.
The pair currently trades last at 1.34472.
The previous day high was 1.3467 while the previous day low was 1.3406. The daily 38.2% Fib levels comes at 1.3444, expected to provide support. Similarly, the daily 61.8% fib level is at 1.3429, expected to provide support.
The USD/CAD pair has shown a recovery move to near 1.3450 after getting faith from a minor recovery in the US Dollar index (DXY). The Loonie asset is looking to recapture Tuesday’s high at 1.3465 as US Treasury yields remained firm despite rising odds of a steady monetary policy announcement by the Federal Reserve (Fed) for its May meeting.
US government bonds have failed to attract demand despite the street anticipating an unchanged interest rate decision by the Fed ahead. The 10-year US Treasury yields have climbed above 3.35%. Also, S&P500 futures have surrendered nominal gains added in the Asian session and have resumed their downside move, portraying further depletion of risk appetite among market participants.
The USD Index has rebounded marginally to near 101.60 after printing a fresh monthly low at 101.45. The downside bias for the USD Index has not faded yet, however, growing anxiety among market participants ahead of United States Employment data is providing a short-term cushion to the US Dollar.
After a decline in Job Openings and Manufacturing PMI data, it would be fine considering a cooldown in the US labor market. Demand for labor has remained extremely solid, however, rising rates are putting a burden on firms as they are facing problems in dealing with issues of higher interest obligations and tight credit conditions by the US banks.
Considering estimates, the US economy has added 200K jobs in March vs. 242K jobs added in February. Weaker-than-anticipated additions of labor would add more pressure on the USD Index ahead.
On the oil front, oil prices are aiming to sustain comfortably above $81.00 in the Asian session. Volatility in the oil price is anticipated ahead of the release of the weekly oil inventory data by the US Energy Information Administration (EIA) for the week ending March 31. It is worth noting that Canada is the leading exporter of oil to the US and higher oil prices would strengthen the Canadian Dollar.
Technical Levels: Supports and Resistances
USDCAD currently trading at 1.3449 at the time of writing. Pair opened at 1.3445 and is trading with a change of 0.03 % .
| Overview | Overview.1 | |
|---|---|---|
| 0 | Today last price | 1.3449 |
| 1 | Today Daily Change | 0.0004 |
| 2 | Today Daily Change % | 0.0300 |
| 3 | Today daily open | 1.3445 |
The pair is trading below its 20 Daily moving average @ 1.367, below its 50 Daily moving average @ 1.3546 , below its 100 Daily moving average @ 1.3524 and above its 200 Daily moving average @ 1.3381
| Trends | Trends.1 | |
|---|---|---|
| 0 | Daily SMA20 | 1.3670 |
| 1 | Daily SMA50 | 1.3546 |
| 2 | Daily SMA100 | 1.3524 |
| 3 | Daily SMA200 | 1.3381 |
The previous day high was 1.3467 while the previous day low was 1.3406. The daily 38.2% Fib levels comes at 1.3444, expected to provide support. Similarly, the daily 61.8% fib level is at 1.3429, expected to provide support.
Note the levels of interest below:
- Pivot support is noted at 1.3411, 1.3378, 1.335
- Pivot resistance is noted at 1.3473, 1.3501, 1.3535
| Levels | Levels.1 |
|---|---|
| Previous Daily High | 1.3467 |
| Previous Daily Low | 1.3406 |
| Previous Weekly High | 1.3745 |
| Previous Weekly Low | 1.3508 |
| Previous Monthly High | 1.3862 |
| Previous Monthly Low | 1.3508 |
| Daily Fibonacci 38.2% | 1.3444 |
| Daily Fibonacci 61.8% | 1.3429 |
| Daily Pivot Point S1 | 1.3411 |
| Daily Pivot Point S2 | 1.3378 |
| Daily Pivot Point S3 | 1.3350 |
| Daily Pivot Point R1 | 1.3473 |
| Daily Pivot Point R2 | 1.3501 |
| Daily Pivot Point R3 | 1.3535 |
[/s2If]
Join Our Telegram Group
")


