#USDCAD @ 1.34341 bulls are moving in as bears move out. (Pivot Orderbook analysis)
…
This is a premium post.
[s2If !current_user_can(access_s2member_level4)]Please register for PREMIUM VERSION HERE to read full post below containing analysis. In case of any error or you think you are not able to read the full post below, please email us at support#nehcap.com [lwa][/s2If] [s2If current_user_can(access_s2member_level4)]
- USD/CAD bulls are moving in as bears move out.
- The focus will turn to Canadian data and then US NFP.
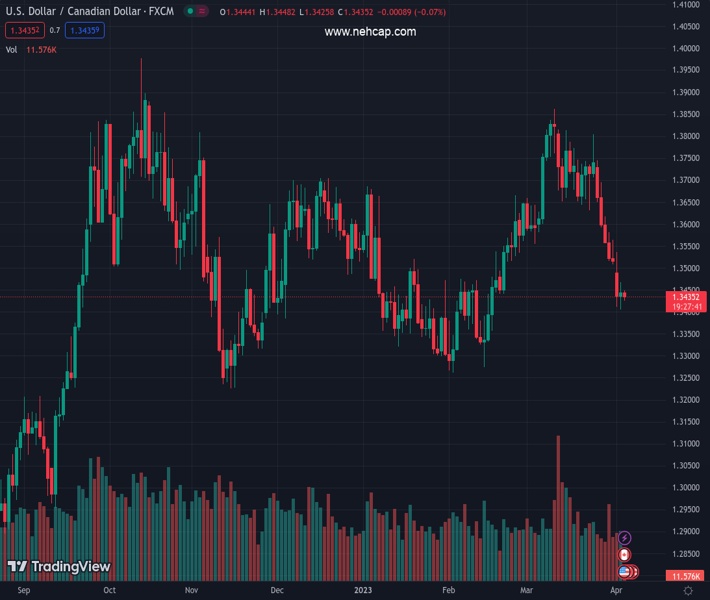
The pair currently trades last at 1.34341.
The previous day high was 1.3467 while the previous day low was 1.3406. The daily 38.2% Fib levels comes at 1.3444, expected to provide resistance. Similarly, the daily 61.8% fib level is at 1.3429, expected to provide support.
USD/CAD is flat on the day so far sticking to a range of between 1.3425 and 1.3448 so far as the price continues to consolidate at the bottom of the prior day’s bearish sell-off when the price fell from the 1.37s towards the end of last month´s trade.
Gains in the CAD in recent times come on the back of a calming in financial markets as stress in the global banking sector showed signs of easing and stronger oil prices. The price of oil, one of Canada’s major exports, added to Monday’s impressive rally that followed OPEC+ plans to cut more production. WTI is sat near the $81.75 highs made yesterday.
However, the Loonie has been unable to fully capitalize on the US dollarçs weakness and poor data this week as it tests into key daily support that has resulted in profit taking. The greenback was pressured after a plunge in US factory activity raised concerns over slowing economic growth. US factory orders declined for a second straight month, down 0.7% in February after falling 2.1% in January from the 1.7% jump in December. This data comes on the heels of the Institute for Supply Management (ISM) that yesterday reported that its Manufacturing PMI fell to 46.3 last month. This was the worst since May 2020, from 47.7 in February.
The greenback was pressured last week on the back of Friday´s PCE data, the Federal Reserve´s preferred inflation measure. this came in mixed. While headline and core both came in a tick lower than expected, super core accelerated for a second straight month to 4.63% YoY which is the highest since October. ´´This is not the direction that the Fed desires and so we look for the hawkish tilt in Fed comments to continue,´´ analysts at Brown Brothers Harriman explained.
The market´s attention will turn to Friday’s Nonfarm Payrolls jobs report, although many markets will be closed for the Easter holiday. ´´US payrolls likely stayed firm at a still above-trend pace in March, though slowing from stronger prints in Jan-Feb,´´ the analysts at TD Securities explained. ´´We also look for the Unemployment Rate to stay unchanged at 3.6%, and wage growth to print a firm 0.3% MoM.´´
Domestically, Canadian building permits jumped 8.6% in February compared to the previous month, after a revised 3.7% decline in January. Looking ahead, Canada’s trade balance for February will be reported on Wednesday and the March employment report, set for release on Thursday, will be eyed.
Technical Levels: Supports and Resistances
USDCAD currently trading at 1.3434 at the time of writing. Pair opened at 1.3445 and is trading with a change of -0.08 % .
| Overview | Overview.1 | |
|---|---|---|
| 0 | Today last price | 1.3434 |
| 1 | Today Daily Change | -0.0011 |
| 2 | Today Daily Change % | -0.0800 |
| 3 | Today daily open | 1.3445 |
The pair is trading below its 20 Daily moving average @ 1.367, below its 50 Daily moving average @ 1.3546 , below its 100 Daily moving average @ 1.3524 and above its 200 Daily moving average @ 1.3381
| Trends | Trends.1 | |
|---|---|---|
| 0 | Daily SMA20 | 1.3670 |
| 1 | Daily SMA50 | 1.3546 |
| 2 | Daily SMA100 | 1.3524 |
| 3 | Daily SMA200 | 1.3381 |
The previous day high was 1.3467 while the previous day low was 1.3406. The daily 38.2% Fib levels comes at 1.3444, expected to provide resistance. Similarly, the daily 61.8% fib level is at 1.3429, expected to provide support.
Note the levels of interest below:
- Pivot support is noted at 1.3411, 1.3378, 1.335
- Pivot resistance is noted at 1.3473, 1.3501, 1.3535
| Levels | Levels.1 |
|---|---|
| Previous Daily High | 1.3467 |
| Previous Daily Low | 1.3406 |
| Previous Weekly High | 1.3745 |
| Previous Weekly Low | 1.3508 |
| Previous Monthly High | 1.3862 |
| Previous Monthly Low | 1.3508 |
| Daily Fibonacci 38.2% | 1.3444 |
| Daily Fibonacci 61.8% | 1.3429 |
| Daily Pivot Point S1 | 1.3411 |
| Daily Pivot Point S2 | 1.3378 |
| Daily Pivot Point S3 | 1.3350 |
| Daily Pivot Point R1 | 1.3473 |
| Daily Pivot Point R2 | 1.3501 |
| Daily Pivot Point R3 | 1.3535 |
[/s2If]
Join Our Telegram Group
")


