The oil price has stretched its recovery above $81.70 as the Fed is expected to adopt a neutral stance ahead. (Pivot Orderbook analysis)
…
This is a premium post.
[s2If !current_user_can(access_s2member_level4)]Please register for PREMIUM VERSION HERE to read full post below containing analysis. In case of any error or you think you are not able to read the full post below, please email us at support#nehcap.com [lwa][/s2If] [s2If current_user_can(access_s2member_level4)]
- The oil price has stretched its recovery above $81.70 as the Fed is expected to adopt a neutral stance ahead.
- Accelerating fears of a recession in the US have stemmed the need of pausing the rate-hiking spell sooner.
- The oil price is expected to remain volatile ahead of the release of the weekly inventory data by the US EIA.
The pair currently trades last at 81.05.
The previous day high was 81.81 while the previous day low was 79.63. The daily 38.2% Fib levels comes at 80.97, expected to provide support. Similarly, the daily 61.8% fib level is at 80.46, expected to provide support.
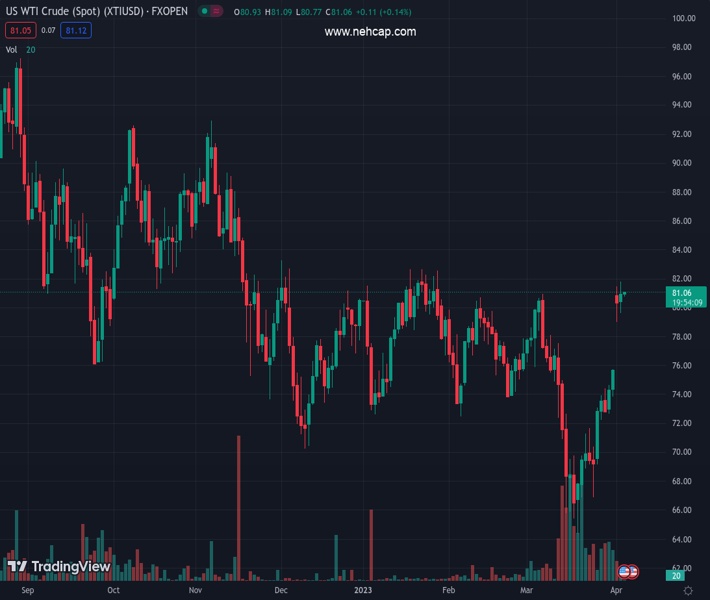
West Texas Intermediate (WTI), futures on NYMEX, have stretched their recovery to near $81.00 in the Asian session. The oil price is expected to recapture a two-month high of $81.74 as the cooling United States economy due to contracting manufacturing activities and a slowdown in job openings have triggered the requirement of an early pause in the policy-tightening spell by the Federal Reserve (Fed).
The upside move in the oil price is also backed by the weak US Dollar Index (DXY), which has refreshed its monthly low below 101.50. Accelerating fears of a recession in the United States have stemmed the need of pausing the rate-hiking spell sooner. Investors would get more clarity after the release of the US Employment data.
Also, the oil price is expected to remain volatile ahead of the release of the weekly inventory data by the US Energy Information Administration (EIA) for the week ending March 31. On Tuesday, the US American Petroleum Institute (API) reported a decline in oil inventories by 4.3 million barrels.
On a daily scale, the oil price is marching towards the horizontal resistance plotted from December 01 high at $83.30 after a V-shape recovery. The V-shape recovery indicates the presence of strong buyers at lower levels, which considered the asset a value buy at those levels.
The asset is highly skewed from the 10-period Exponential Moving Average (EMA) at $76.38, which indicates a solid upside momentum.
Also, the Relative Strength Index (RSI) (14) has climbed into the bullish range of 60.00-80.00 for the first time in the past nine months, indicating signs of a bullish reversal.
Should the oil price break above April 03 high near $81.60, bulls will drive the asset towards December 01 high at $83.30 followed by October 21 high at $85.66.
On the flip side, a downside move below March 31 low at $73.31 would drag the asset towards March 23 high at $71.69. A break below the latter would further drag the oil price toward March 27 low at $69.18.
Technical Levels: Supports and Resistances
XTIUSD currently trading at 81.05 at the time of writing. Pair opened at 81.02 and is trading with a change of 0.04 % .
| Overview | Overview.1 | |
|---|---|---|
| 0 | Today last price | 81.05 |
| 1 | Today Daily Change | 0.03 |
| 2 | Today Daily Change % | 0.04 |
| 3 | Today daily open | 81.02 |
The pair is trading above its 20 Daily moving average @ 72.79, above its 50 Daily moving average @ 75.76 , above its 100 Daily moving average @ 76.85 and below its 200 Daily moving average @ 83.35
| Trends | Trends.1 | |
|---|---|---|
| 0 | Daily SMA20 | 72.79 |
| 1 | Daily SMA50 | 75.76 |
| 2 | Daily SMA100 | 76.85 |
| 3 | Daily SMA200 | 83.35 |
The previous day high was 81.81 while the previous day low was 79.63. The daily 38.2% Fib levels comes at 80.97, expected to provide support. Similarly, the daily 61.8% fib level is at 80.46, expected to provide support.
Note the levels of interest below:
- Pivot support is noted at 79.83, 78.65, 77.66
- Pivot resistance is noted at 82.0, 82.99, 84.18
| Levels | Levels.1 |
|---|---|
| Previous Daily High | 81.81 |
| Previous Daily Low | 79.63 |
| Previous Weekly High | 75.78 |
| Previous Weekly Low | 69.18 |
| Previous Monthly High | 80.99 |
| Previous Monthly Low | 64.39 |
| Daily Fibonacci 38.2% | 80.97 |
| Daily Fibonacci 61.8% | 80.46 |
| Daily Pivot Point S1 | 79.83 |
| Daily Pivot Point S2 | 78.65 |
| Daily Pivot Point S3 | 77.66 |
| Daily Pivot Point R1 | 82.00 |
| Daily Pivot Point R2 | 82.99 |
| Daily Pivot Point R3 | 84.18 |
[/s2If]
Join Our Telegram Group
")


