#AUDNZD @ 1.06976 holds lower ground after reversing from two-week high the previous day., @nehcap view: Further downside expected (Pivot Orderbook analysis)
…
This is a premium post.
[s2If !current_user_can(access_s2member_level4)]Please register for PREMIUM VERSION HERE to read full post below containing analysis. In case of any error or you think you are not able to read the full post below, please email us at support#nehcap.com [lwa][/s2If] [s2If current_user_can(access_s2member_level4)]
- AUD/NZD holds lower ground after reversing from two-week high the previous day.
- RBNZ is likely to increase benchmark rates by 0.25% but Rate Statement will be crucial to watch amid recent dovish bias.
- One-month-old descending triangle restricts short-term moves amid sluggish MACD.
- 100-DMA acts as an extra filter towards the north.
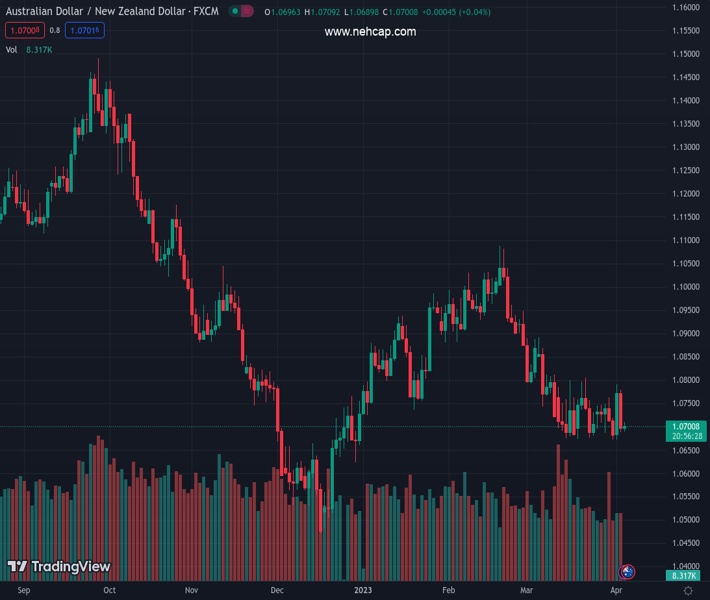
The pair currently trades last at 1.06976.
The previous day high was 1.0792 while the previous day low was 1.0682. The daily 38.2% Fib levels comes at 1.075, expected to provide resistance. Similarly, the daily 61.8% fib level is at 1.0724, expected to provide resistance.
AUD/NZD remains pressured around 1.0700 as traders await the Reserve Bank of New Zealand (RBNZ) monetary policy decision on early Wednesday.
Also read: RBNZ Interest Rate Decision Preview: Hawkish guidance yet again?
The exotic pair dropped the most in a month the previous day while reversing from a resistance line of a one-month-old descending triangle formation.
It should be noted, however, that the sluggish MACD and unimpressive RSI (14) suggest that the AUD/NZD price may defend the triangle formation, which in turn hints at a limited downside room towards the stated pattern’s support line of near 1.0670 by the press time.
That said, the quote’s sustained trading below the 100-DMA and the 61.8% Fibonacci retracement of its December 2022 to February 2023 upside keeps it on the bear’s radar.
Hence, a downside break of 1.0670 won’t hesitate to target the late 2022 low of near 1.0470. Though, the 1.0600 and 1.0500 levels may act as intermediate halts during the expected fall.
On the flip side, a clear break of the triangle’s top line, close to 1.0775 at the latest, becomes necessary for the AUD/NZD buyers to get in.
Even so, the 50% Fibonacci retracement level and 100-DMA hurdles of 1.0780 and 1.0795 in that order can challenge the pair bulls before giving them control.
Trend: Further downside expected
Technical Levels: Supports and Resistances
AUDNZD currently trading at 1.0699 at the time of writing. Pair opened at 1.0776 and is trading with a change of -0.71% % .
| Overview | Overview.1 | |
|---|---|---|
| 0 | Today last price | 1.0699 |
| 1 | Today Daily Change | -0.0077 |
| 2 | Today Daily Change % | -0.71% |
| 3 | Today daily open | 1.0776 |
The pair remains strongly bearish on the daily time frame. It trades below the 20 SMA @ 1.0735, 50 SMA 1.086, 100 SMA @ 1.0801 and 200 SMA @ 1.0967.
| Trends | Trends.1 | |
|---|---|---|
| 0 | Daily SMA20 | 1.0735 |
| 1 | Daily SMA50 | 1.0860 |
| 2 | Daily SMA100 | 1.0801 |
| 3 | Daily SMA200 | 1.0967 |
The previous day high was 1.0792 while the previous day low was 1.0682. The daily 38.2% Fib levels comes at 1.075, expected to provide resistance. Similarly, the daily 61.8% fib level is at 1.0724, expected to provide resistance.
Note the levels of interest below:
- Pivot support is noted at 1.0708, 1.064, 1.0598
- Pivot resistance is noted at 1.0818, 1.086, 1.0928
| Levels | Levels.1 |
|---|---|
| Previous Daily High | 1.0792 |
| Previous Daily Low | 1.0682 |
| Previous Weekly High | 1.0763 |
| Previous Weekly Low | 1.0672 |
| Previous Monthly High | 1.0892 |
| Previous Monthly Low | 1.0672 |
| Daily Fibonacci 38.2% | 1.0750 |
| Daily Fibonacci 61.8% | 1.0724 |
| Daily Pivot Point S1 | 1.0708 |
| Daily Pivot Point S2 | 1.0640 |
| Daily Pivot Point S3 | 1.0598 |
| Daily Pivot Point R1 | 1.0818 |
| Daily Pivot Point R2 | 1.0860 |
| Daily Pivot Point R3 | 1.0928 |
[/s2If]
Join Our Telegram Group
")


