#XAUUSD @ 1,959.05 Gold price picks up bids to consolidate recent losses near the lowest levels in one week., @nehcap view: Limited recovery expected (Pivot Orderbook analysis)
…
This is a premium post.
[s2If !current_user_can(access_s2member_level4)]Please register for PREMIUM VERSION HERE to read full post below containing analysis. In case of any error or you think you are not able to read the full post below, please email us at support#nehcap.com [lwa][/s2If] [s2If current_user_can(access_s2member_level4)]
- Gold price picks up bids to consolidate recent losses near the lowest levels in one week.
- Markets dwindle amid downbeat Fed bets, inflation woes emanating from OPEC+ and mixed US data.
- US PMIs for March, ADP Employment Change can offer intermediate directions to Gold price ahead of Friday’s key jobs report.
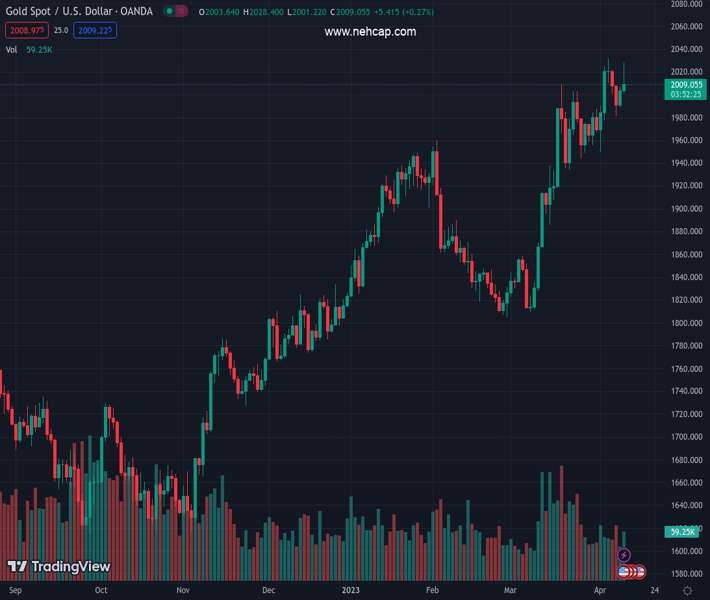
The pair currently trades last at 1959.05.
The previous day high was 1987.7 while the previous day low was 1966.95. The daily 38.2% Fib levels comes at 1974.88, expected to provide resistance. Similarly, the daily 61.8% fib level is at 1979.77, expected to provide resistance.
Gold price (XAU/USD) trims intraday losses near $1,955 amid early Monday morning in Europe. In doing so, the bright metal rebounds from a one-week low marked earlier in the day as traders reassess the week-start challenges to the sentiment that initially favored the US Dollar strength.
US Dollar Index (DXY) retreats from an intraday high of 103.05 to 102.90 as the early-day risk aversion fades amid receding hawkish bets on the Federal Reserve (Fed). Also challenging the greenback’s gauge versus the six major currencies are the concerns suggesting China and Brazil’s dropping of the US Dollar for cross-border trade.
It’s worth noting that the Organization of the Petroleum Exporting Countries (OPEC) and its allies led by Russia, known as OPEC+, announced 1.16 million barrels per day of output cut and renewed inflation fears earlier in the day. The same exert downside pressure on the Gold price via a firmer US Dollar. However, easing hopes of another strong rate hike from the US Federal Reserve (Fed) seems to weigh on the US Dollar and allow the Gold price to lick its wounds.
As per the latest readings of CME’s FedWatch Tool, market players place nearly 42% probability on the 0.25% Fed rate hike in May, versus 52% marked on Friday.
Elsewhere, softer China Caixin Manufacturing PMI jostles with the Sino-American tension the market’s pre-NFP caution to challenge the XAU/USD traders.
Moving on, US ISM Manufacturing & S&P Global Manufacturing PMI could entertain Gold traders ahead of Friday’s US jobs report.
The RSI (14) rebound from oversold territory allows the Gold price to lick its wounds near the lowest levels in a week.
However, the bearish MACD signals and a clear downside break of a two-week-old ascending trend line, as well as the sustained trading below the 200-HMA and 100-HMA confluence, keep the Gold bears hopeful.
That said, the latest recovery remains elusive unless crossing the $1,960 support-turned-resistance line.
Even if the quote crosses the $1,960 immediate hurdle, the aforementioned HMA convergence, close to $1,970, appears a tough nut to crack for the XAU/USD bulls.
It’s worth noting that a downward-sloping resistance line from March 20, near $1,987 at the latest, restricts the short-term upside of the Gold price.
Meanwhile, a downside break of the latest swing low surrounding $1,950 could refresh the south-run targeting the 61.8% Fibonacci retracement level of the XAU/USD’s March 15-20 upside, near $1,933.
Overall, the Gold price remains on the bear’s radar despite the latest corrective bounce.
Trend: Limited recovery expected
Technical Levels: Supports and Resistances
XAUUSD currently trading at 1956.47 at the time of writing. Pair opened at 1969 and is trading with a change of -0.64% % .
| Overview | Overview.1 | |
|---|---|---|
| 0 | Today last price | 1956.47 |
| 1 | Today Daily Change | -12.53 |
| 2 | Today Daily Change % | -0.64% |
| 3 | Today daily open | 1969 |
The pair remains strongly bullish on the daily timeframe. It trades above its 20 SMA @ 1926.26, 50 SMA 1893.07, 100 SMA @ 1852.78 and 200 SMA @ 1783.91.
| Trends | Trends.1 | |
|---|---|---|
| 0 | Daily SMA20 | 1926.26 |
| 1 | Daily SMA50 | 1893.07 |
| 2 | Daily SMA100 | 1852.78 |
| 3 | Daily SMA200 | 1783.91 |
The previous day high was 1987.7 while the previous day low was 1966.95. The daily 38.2% Fib levels comes at 1974.88, expected to provide resistance. Similarly, the daily 61.8% fib level is at 1979.77, expected to provide resistance.
Note the levels of interest below:
- Pivot support is noted at 1961.4, 1953.8, 1940.65
- Pivot resistance is noted at 1982.15, 1995.3, 2002.9
| Levels | Levels.1 |
|---|---|
| Previous Daily High | 1987.70 |
| Previous Daily Low | 1966.95 |
| Previous Weekly High | 1987.70 |
| Previous Weekly Low | 1944.08 |
| Previous Monthly High | 2009.88 |
| Previous Monthly Low | 1809.46 |
| Daily Fibonacci 38.2% | 1974.88 |
| Daily Fibonacci 61.8% | 1979.77 |
| Daily Pivot Point S1 | 1961.40 |
| Daily Pivot Point S2 | 1953.80 |
| Daily Pivot Point S3 | 1940.65 |
| Daily Pivot Point R1 | 1982.15 |
| Daily Pivot Point R2 | 1995.30 |
| Daily Pivot Point R3 | 2002.90 |
[/s2If]
Join Our Telegram Group
")


