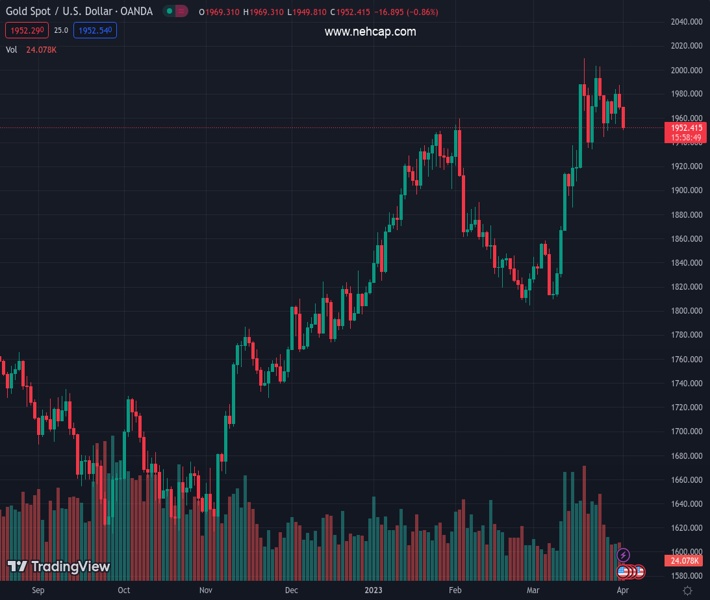
#XAUUSD @ 1,952.30 Gold price is likely to deliver a break below $1,950.00 amid rising hawkish Fed bets. (Pivot Orderbook analysis)
…
This is a premium post.
[s2If !current_user_can(access_s2member_level4)]Please register for PREMIUM VERSION HERE to read full post below containing analysis. In case of any error or you think you are not able to read the full post below, please email us at support#nehcap.com [lwa][/s2If] [s2If current_user_can(access_s2member_level4)]
- Gold price is likely to deliver a break below $1,950.00 amid rising hawkish Fed bets.
- The USD Index has printed a fresh weekly high above 103.00 as US inflation looks set for a rebound.
- Gold price has delivered a breakdown of the volatility contraction pattern.
The pair currently trades last at 1952.30.
The previous day high was 1987.7 while the previous day low was 1966.95. The daily 38.2% Fib levels comes at 1974.88, expected to provide resistance. Similarly, the daily 61.8% fib level is at 1979.77, expected to provide resistance.
Gold price (XAU/USD) is hovering near the edge of $1,950.00 after a sheer sell-off in the Asian session. The Gold price is expected to extend its losses as higher oil prices after OPEC+ decision of contracting production has renewed fears of a rebound in the United States inflation. Higher oil prices are likely to force factory owners to hike the prices of goods and services at factory gates, which will propel the Producer Price Index (PPI). Eventually, the US inflationary pressures would be fueled significantly.
The context of higher inflation expectations has infused fresh blood into the US Dollar Index (DXY). The USD Index has refreshed its weekly high above 103.00 as investors believe that the Federal Reserve (Fed) won’t have another alternative than to trigger rates higher. Fed Chair Jerome Powell might announce one more 25 basis points (bps) rate hike in May and will push rates above 5%.
Another catalyst that is weighing heavily on the Gold price is the easing of US banking jitters. Investors have digested the short-term panic produced after the collapse of three mid-size banks and hope that no further casualty will emerge ahead.
Meanwhile, S&P500 futures are failing to recover losses generated in the morning session as higher oil prices are likely to result in higher operating costs for oil-dependent firms. The alpha generated on 10-year Us Treasury yields has jumped above 3.52%.
Gold price has delivered a breakdown of the Symmetrical Triangle chart pattern formed on an hourly scale. A breakdown of the aforementioned chart pattern results in wider ticks and heavy volatility as volatility gets exploded quickly.
The upward-sloping trendline of the Symmetrical Triangle plotted from the March 22 low at $1,934.34 will act as a major barricade for the Gold bulls.
The declining 21-period Exponential Moving Average (EMA) at $1,966.20 indicates more weakness ahead.
Adding to that, the Relative Strength Index (RSI) (14) has slipped into the bearish range of 20.00-40.00, which indicates that the downside momentum has been triggered.
Technical Levels: Supports and Resistances
XAUUSD currently trading at 1951.44 at the time of writing. Pair opened at 1969.0 and is trading with a change of -0.89 % .
| Overview | Overview.1 | |
|---|---|---|
| 0 | Today last price | 1951.44 |
| 1 | Today Daily Change | -17.56 |
| 2 | Today Daily Change % | -0.89 |
| 3 | Today daily open | 1969.00 |
The pair remains strongly bullish on the daily timeframe. It trades above its 20 SMA @ 1926.26, 50 SMA 1893.07, 100 SMA @ 1852.78 and 200 SMA @ 1783.91.
| Trends | Trends.1 | |
|---|---|---|
| 0 | Daily SMA20 | 1926.26 |
| 1 | Daily SMA50 | 1893.07 |
| 2 | Daily SMA100 | 1852.78 |
| 3 | Daily SMA200 | 1783.91 |
The previous day high was 1987.7 while the previous day low was 1966.95. The daily 38.2% Fib levels comes at 1974.88, expected to provide resistance. Similarly, the daily 61.8% fib level is at 1979.77, expected to provide resistance.
Note the levels of interest below:
- Pivot support is noted at 1961.4, 1953.8, 1940.65
- Pivot resistance is noted at 1982.15, 1995.3, 2002.9
| Levels | Levels.1 |
|---|---|
| Previous Daily High | 1987.70 |
| Previous Daily Low | 1966.95 |
| Previous Weekly High | 1987.70 |
| Previous Weekly Low | 1944.08 |
| Previous Monthly High | 2009.88 |
| Previous Monthly Low | 1809.46 |
| Daily Fibonacci 38.2% | 1974.88 |
| Daily Fibonacci 61.8% | 1979.77 |
| Daily Pivot Point S1 | 1961.40 |
| Daily Pivot Point S2 | 1953.80 |
| Daily Pivot Point S3 | 1940.65 |
| Daily Pivot Point R1 | 1982.15 |
| Daily Pivot Point R2 | 1995.30 |
| Daily Pivot Point R3 | 2002.90 |
[/s2If]
Join Our Telegram Group
")


